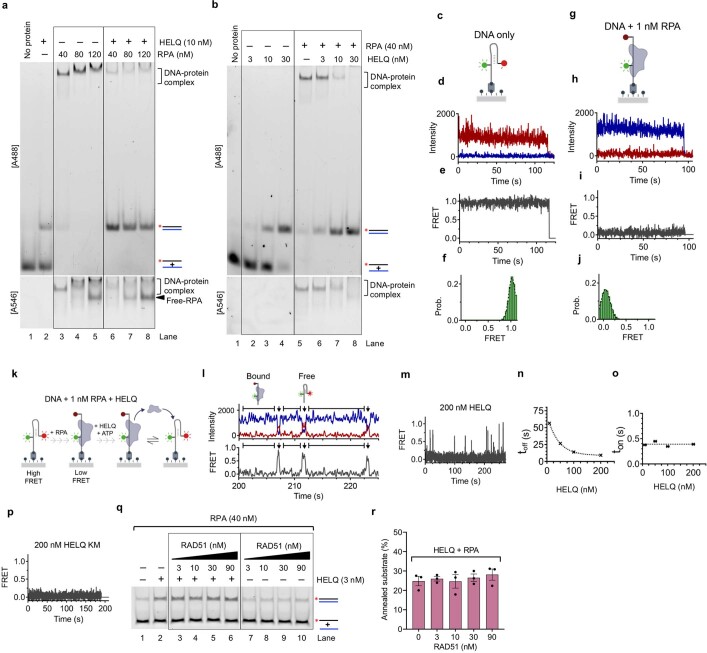
Extended Data Fig. 6. HELQ strips RPA from ssDNA.
a. Native gel (longer 6% polyacrylamide) showing RPA stripping assay with HELQ (10 nM) alone and with indicated concentrations of RPA. b, Native gel (longer 6% polyacrylamide) showing RPA stripping assay with indicated concentrations of HELQ in the absence and presence of RPA (40 nM). c, Schematic of immobilized dual labelled (Cy3 and Cy5) DNA in the absence of RPA. d–e, Representative intensity trajectory (top) and corresponding FRET trajectory (bottom) of dual labelled DNA in the absence of RPA. f, Time-binned FRET histogram of DNA only, fit with gaussian. g, Schematic of immobilized dual labelled DNA in the presence of RPA. h–i, Representative intensity trajectory (top) and corresponding FRET trajectory (bottom) of dual labelled DNA in the presence of RPA. Stable high FRET is observed. j, Time-binned FRET histogram of DNA in the presence of RPA. Fit with gaussian. k, Schematic of the experimental set up of single-molecule FRET-based RPA striping assay. DNA dual-labelled with the FRET pair Cy3 and Cy5 is immobilized on the microscope slide. In the absence of RPA, a short 6 nt sequence of homology causes the DNA to fold into a high FRET state. Upon RPA binding, the DNA unfolds resulting in a low FRET state. Addition of HELQ results in cycling between the low (bound) and high (free) FRET states as RPA is bound and removed respectively. l, Example of single-molecule fluorescence trajectory (top, Cy3 in blue, Cy5 in red) and corresponding FRET (bottom) showing the transition from low FRET (bound) to high FRET (free). m, Representative FRET trajectory of DNA in the presence of 1 nM RPA and 200 nM HELQ, spikes of high FRET correspond to RPA removal events. n, Plot of dwell time of RPA bound (toff), low FRET, state with increasing HELQ concentration. o, Plot of dwell time of free state (ton), high FRET, on RPA removal with increasing HELQ concentration. p, Representative FRET trajectory of DNA in the presence of 1 nM RPA and 200 nM HELQ KM. q, Representative gel of DNA annealing assay with HELQ (3 nM), RPA (40 nM) and indicated concentrations of RAD51. r, Quantification of experiments such as shown in q. n = 3 independent experiments; mean ± S.E.M.

