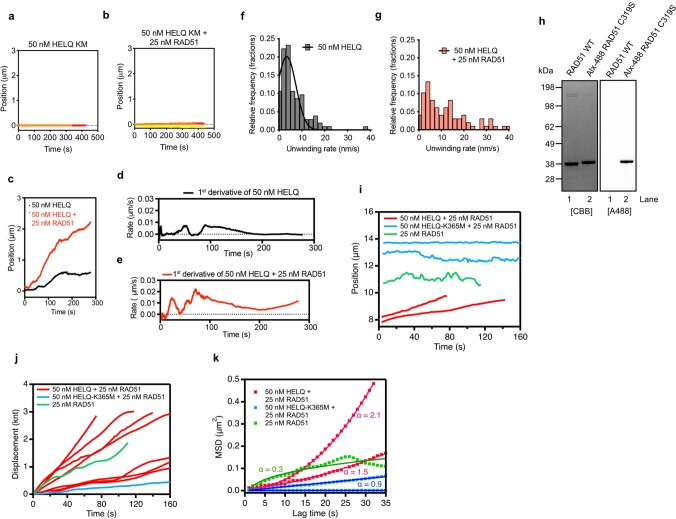
Extended Data Fig. 4. RAD51–HELQ complex translocates along ssDNA backbone.
a–b. Bead centre displacement measured between the traps as a function of time in indicated conditions. Traces represent individual DNA molecules (n ≥ 3). c. Example of two real-time bead displacement traces for indicated conditions. Unwinding bursts of linearly increasing bead distance are interspersed by pauses where no distance change is observed. d-e. First derivative with applied smoothening of traces shown in c. Height of individual peaks corresponds to the rate of individual unwinding bursts. f–g. Histogram showing HELQ unwinding burst rate distribution in the absence (n = 103) and presence (n = 97) of RAD51. Black line in f represents single Gaussian fits. h. Chemical labelling of RAD51. RAD51 C319S was labelled in pH 7.0 using maleimide esters of Alexa Fluor 488. After reaction termination and purification of labelled species, labelling efficiency was assessed, and free dye component was evaluated using SDS-PAGE (4-12%) and subsequent fluorescent imaging. 1:1 labelling stoichiometry was achieved as measured. spectrophotometrically. Proteins were labelled typically with 80-100% labelling efficiency. Single preparation of RAD51 C319S was used in this study. i, Displacement of proteins bound to individual DNA tethers. The representative trajectories illustrate either unidirectional movement (red), 1D diffusion (green) and static binding with occasional diffusion (blue). The positions of molecules in time were measured by fitting a moving window of three kymograph frames with Gaussian function. j, Total displacement of translocating HELQ-Alx–RAD51 complexes (red) used to calculate the translocation rate. Two populations of translocating molecules can be distinguished: faster with the mean rate of 14 ± 5 nm/s and slower with the mean rate of 4 ± 1 nm/s. The slower rate might result due to “pushing” of sparsely bound Alx–RAD51 on DNA by HELQ alone species. The total displacement of a representative RAD51 filament (green) includes all frame-to-frame displacements, regardless of directionality. The stationary molecule apparent displacement (blue) of 2 ± 1 nm/s results from thermal fluctuations of the tethered DNA. k, Mean Square Displacement calculated from the trajectories shown in panel i, plotted as a function of time interval for a period up to 35 sec. Fitting the MSD plot with a power law D∆tα resulted in the factor α > 1 for HELQ-RAD51 complexes (red) indicating their diffusive (directed) motion, in contrast to diffusing RAD51 and HELQ(K365M)-RAD51 complexes (α ≤ 1) (green, blue).

