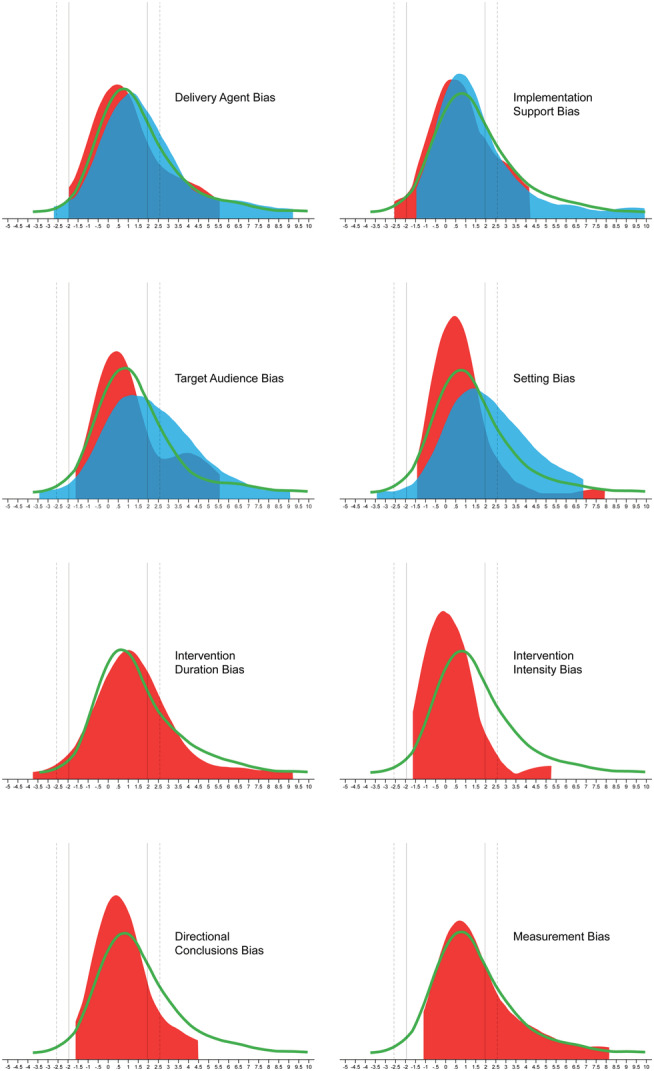
FIGURE 5.

Z value distribution of outcomes in larger scale trials by the absence (green line) of risk of generalizability bias (RGB), RGB present in pilot and absent in larger scale trial (red distribution), and RGB present in both pilot and larger scale trial (blue distribution). Positive z values indicate that the intervention was better than the control group, and negative z values indicate that the control group was better than the intervention group. Solid vertical lines represent z ± 1.96 (p = 0.05); dashed vertical lines represent z ± 2.58 (p = 0.005)
