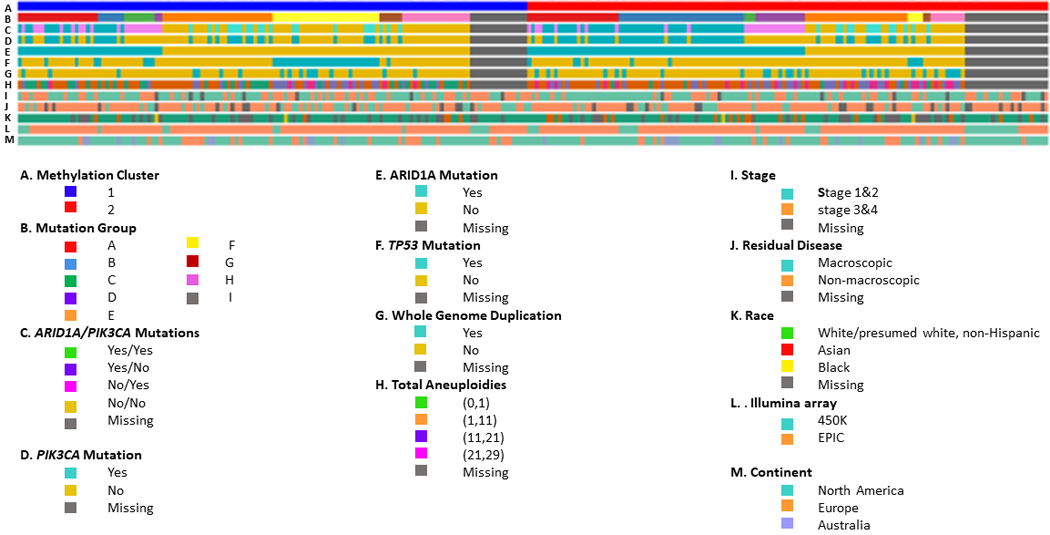
Figure 2. Alignment of Tumor and Clinical Features by DNA Methylation Clusters in 271 OCCC Tumors.

Columns represent samples with those on the left indicating (A) Methylation Cluster 1 tumors and those on the right Methylation Cluster 2 tumors, (B) mutation group (see methods), (C) ARID1A/PIK3CA mutations (yes/yes, yes/no, no/yes, no/no, missing), (D) PIK3CA mutation (yes, no, missing), (E) ARID1A mutation (yes, no, missing), (F) TP53 mutation (yes, no, missing), (G) WGD, whole-genome duplication (yes, no, missing), (H) total aneuploidy (none, 1–10, 11–20, 21–29, missing), (I) stage (early, advanced, missing), (J) residual disease (macroscopic, no macroscopic, missing), (K) race (White non-Hispanic, Asian, Black, missing), (L) Illumina Infinium Beadchip (HumanMethylation450, Methylation EPIC), (M) continent (North America, Europe, Australia). Samples are ordered based on hierarchical clustering which used nsNMF two-cluster analysis, although the dendrogram is suppressed.
