
Figure 2. Intranasal immunization with H1/CDN promotes T cell influx into macrophage aggregates in lungs.
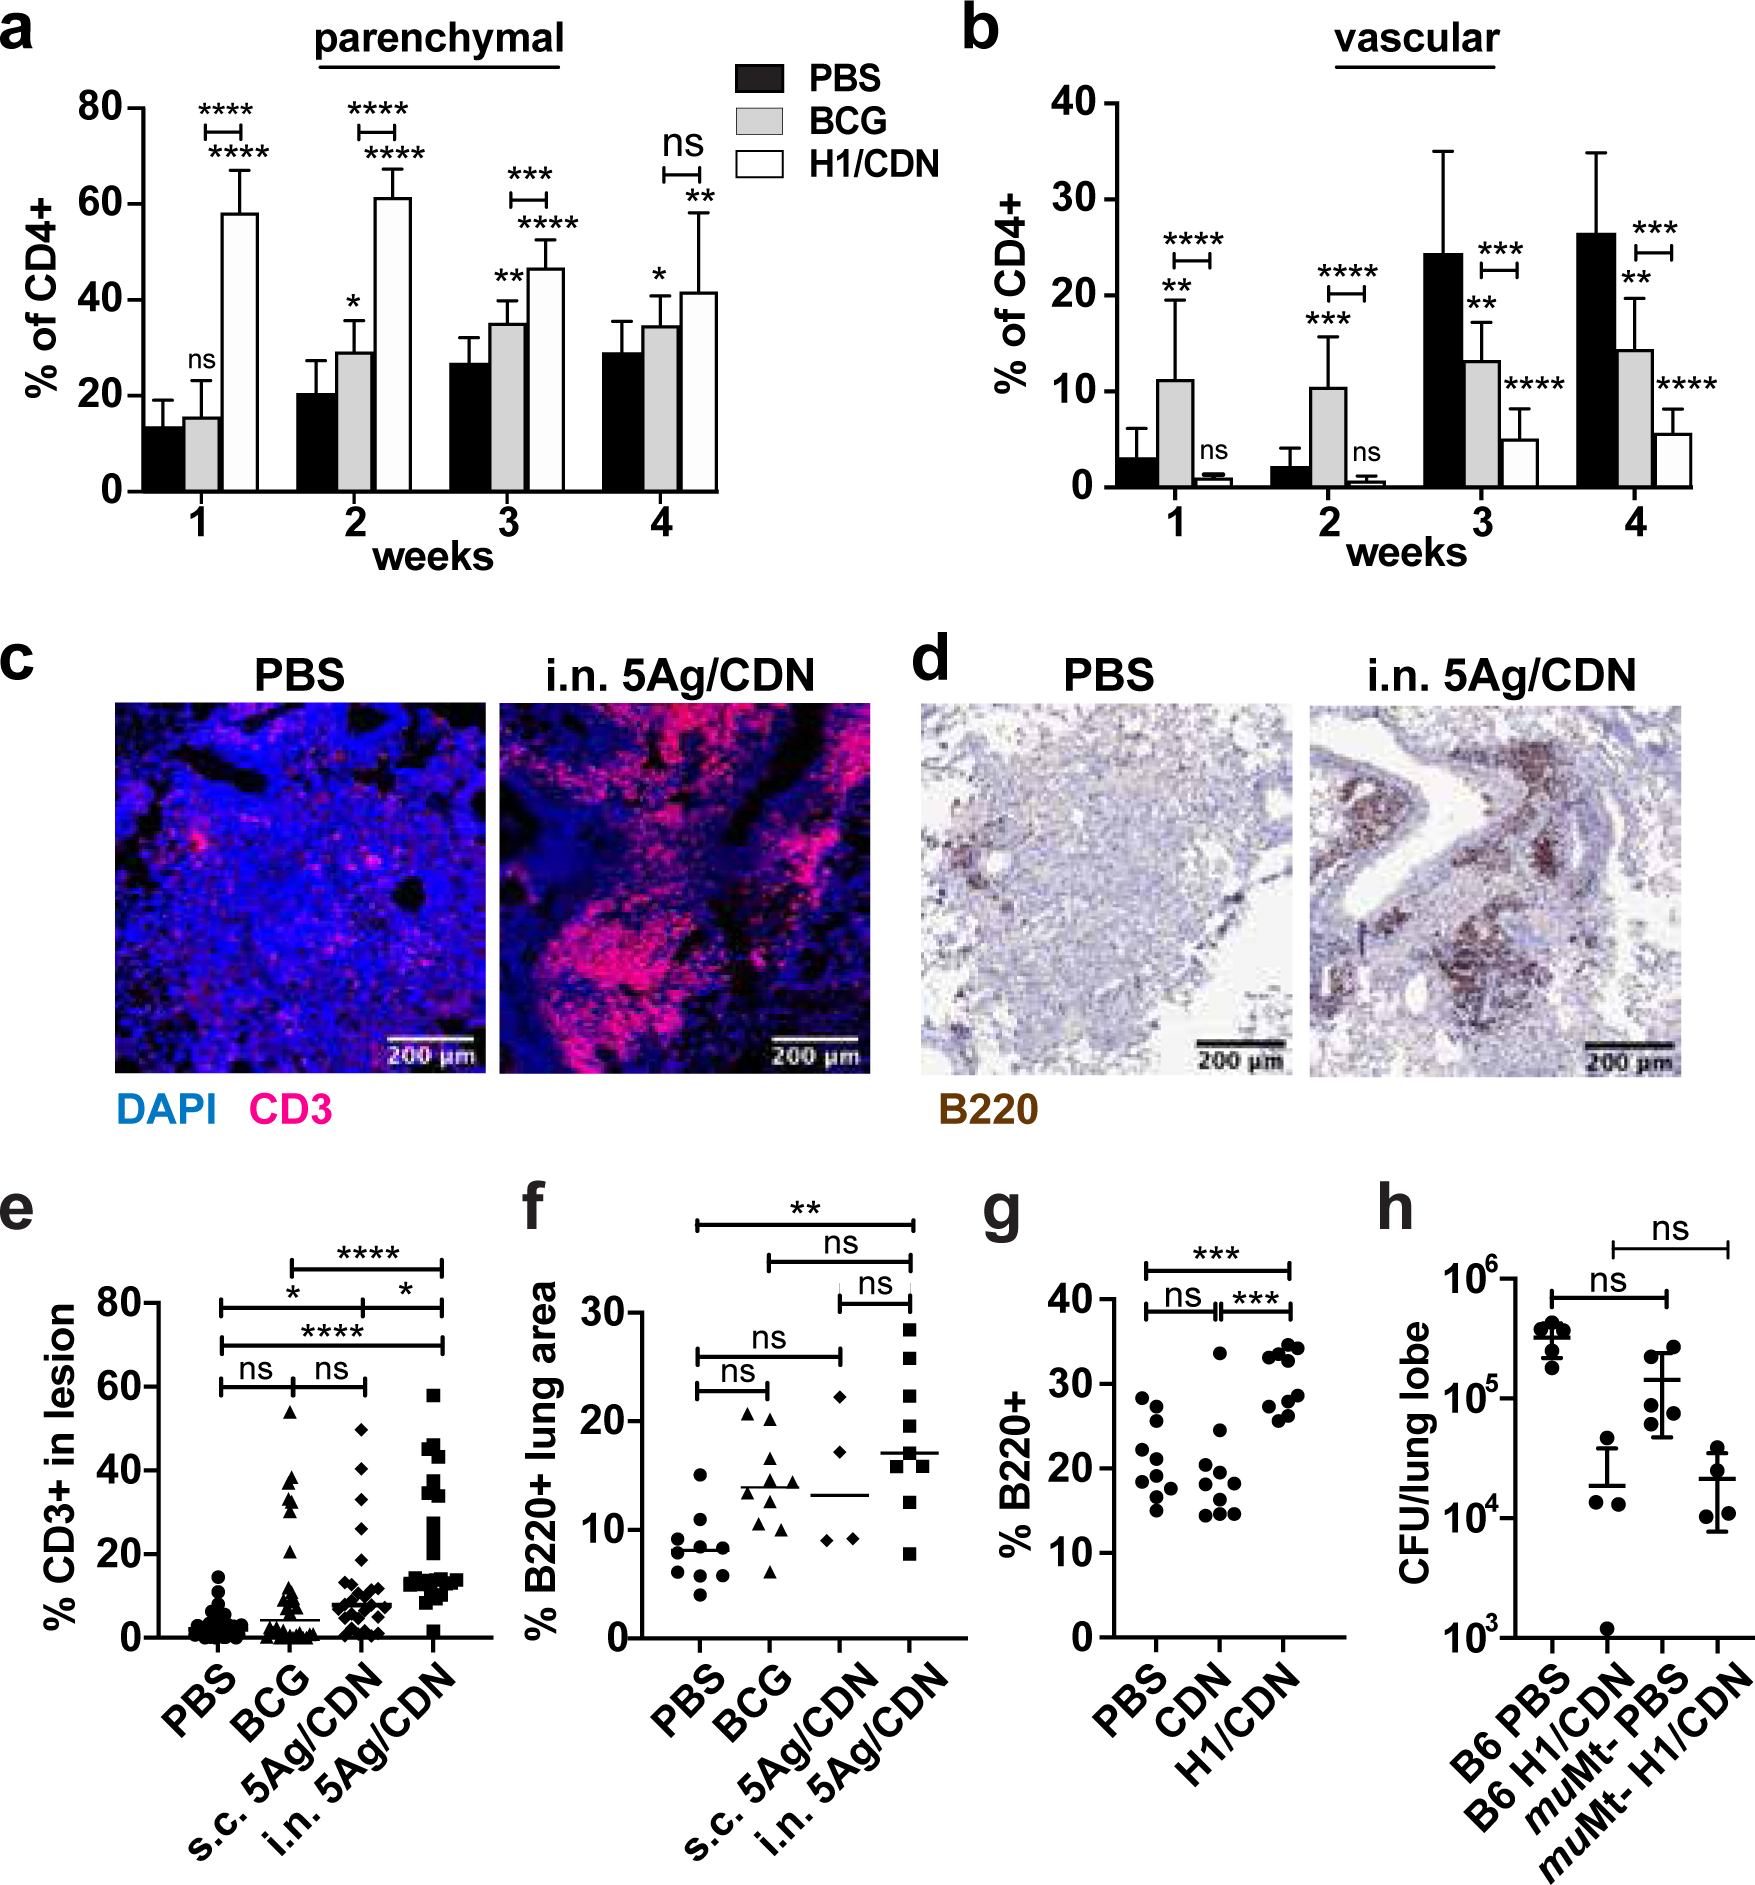
Mice were immunized as described and analyzed at indicated timepoints. (a) Surface staining for percentage of parenchymal CXCR3+ KLRG1− lung CD4 T cells from mock and i.n. H1/ML-RR-cGAMP (i.n. H1/CDN) vaccinated mice. (b) Surface staining for percentage of vascular CXCR3− KLRG1+ lung CD4 T cells. Mice were immunized as described and analyzed at 4 weeks post challenge with M. tuberculosis. (c) Representative immunofluorescent staining of formalin-fixed, paraffin-embedded lung sections from mock and 5Ag/ML-RR-cGAMP-vaccinated mice for T cell marker CD3 and nuclear DAPI stain. (d) Representative immunohistochemical staining of lung sections for B cell marker B220. (e) Quantification of CD3+ immune cells out of total cells in lung lesions. (f) Quantification of B220+ lung area. (g) Percentage of B220+ cells in the lungs at 4 weeks post challenge analyzed by flow cytometry. (h) WT and muMT− mice were immunized with H1/CDN and M. tuberculosis CFU in the lungs was enumerated at 4 weeks post challenge. Data are expressed as mean (± SD) of eight to ten mice per group from two independent experiments; each animal is shown as an individual point. (a, b, g, h) Mann-Whitney t test p values; (e, f) Kruskal Wallis test followed by Dunn multiple comparison posthoc p-values; *p ≤ 0.05, **p ≤ 0.01, ***p ≤ 0.001, ****p ≤ 0.0001. Significance is relative to PBS control unless otherwise indicated. All experiments were performed a minimum of twice; a-f a representative experiment is shown, for g-h pooled data from 2 experiments is shown.