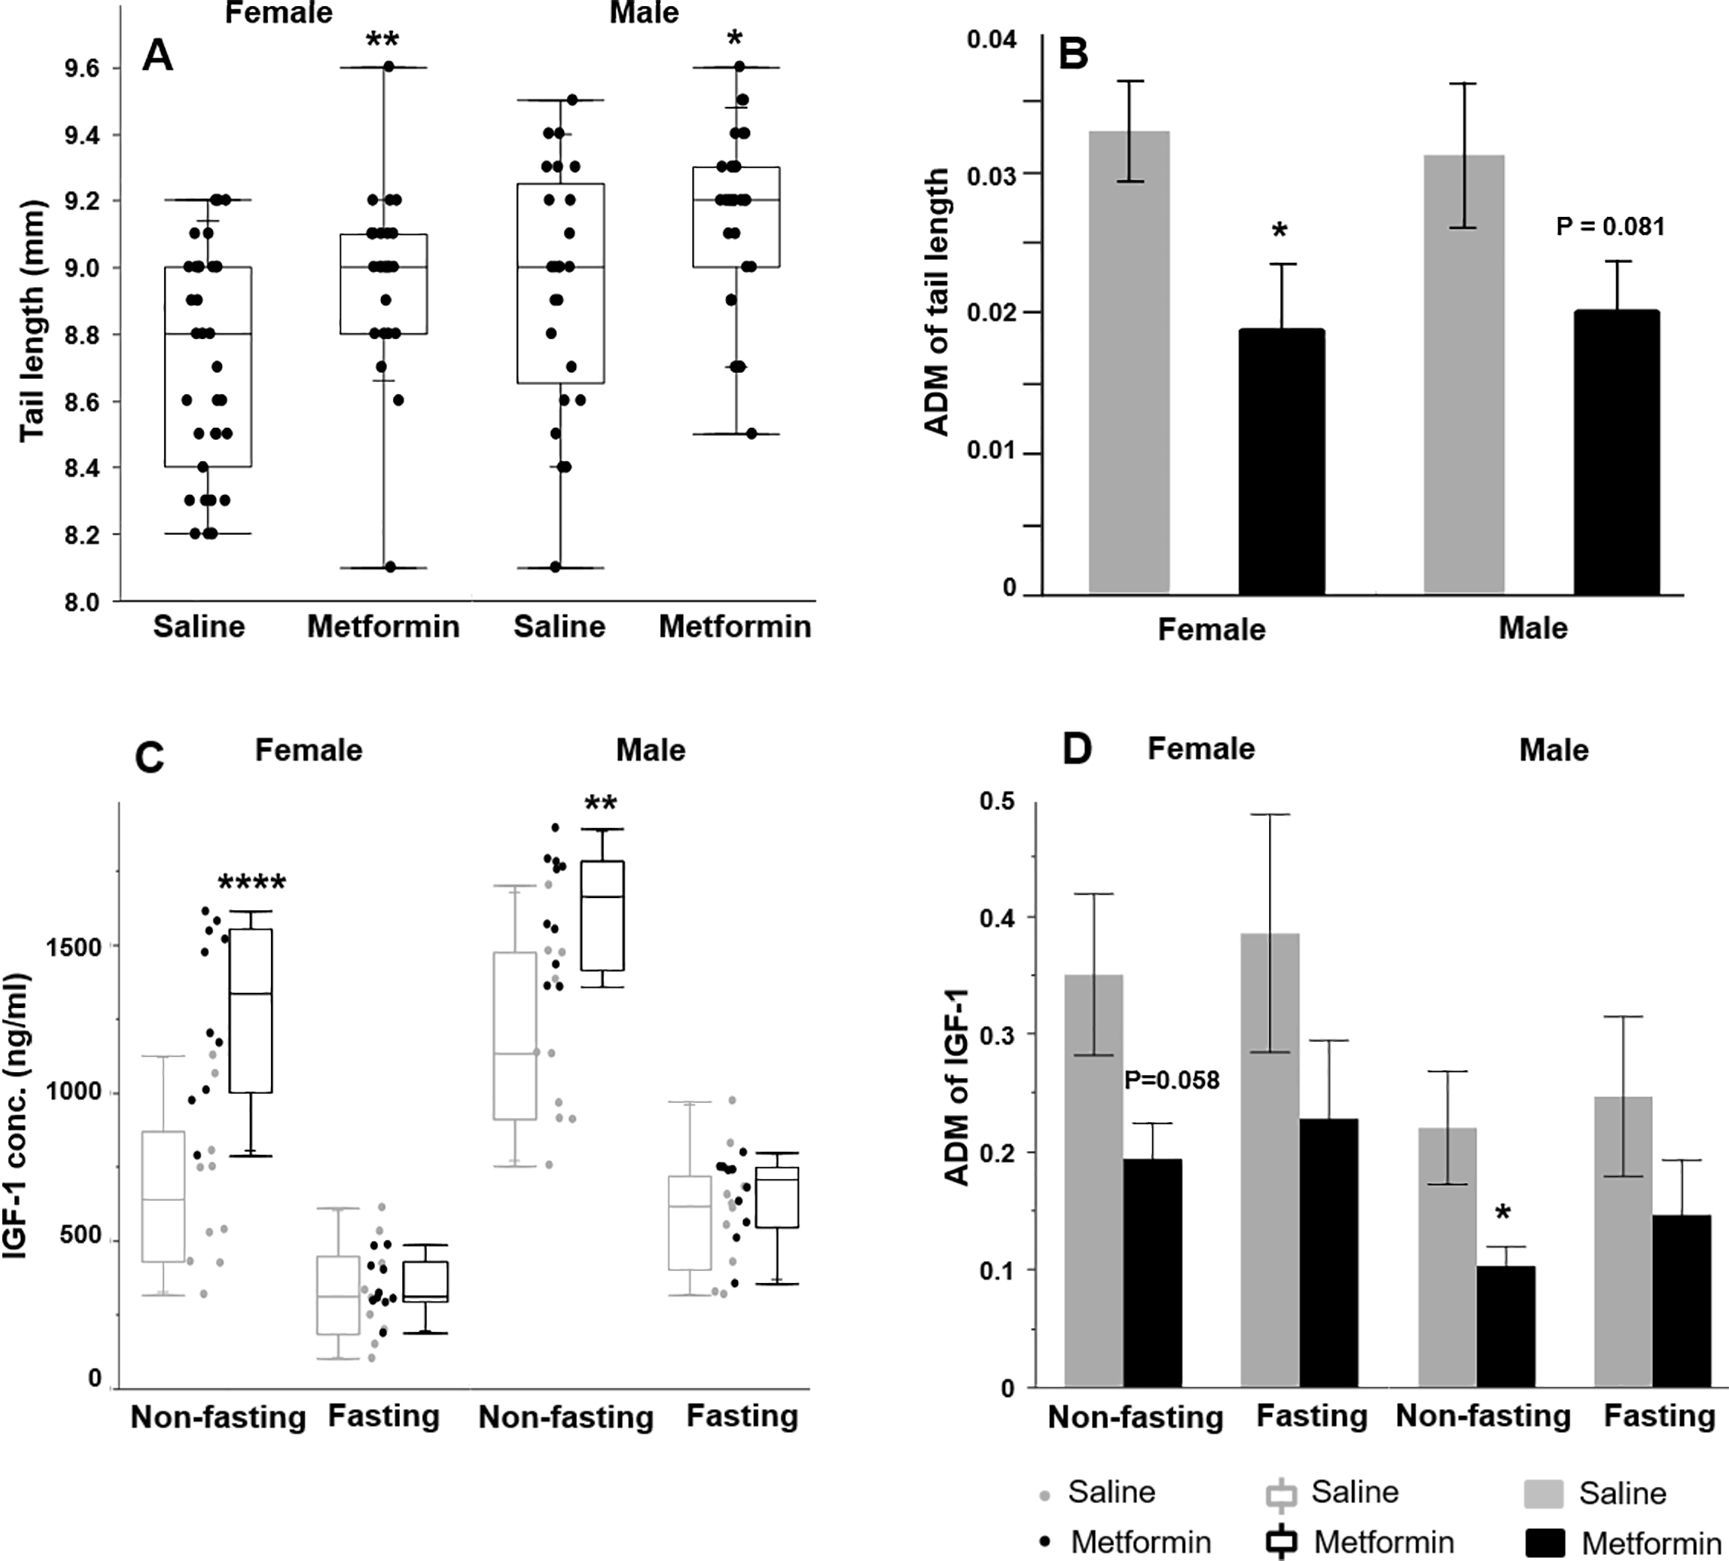
Figure 3. Metformin increases tail length and non-fasting IGF1 but reduces the variations.

(A) Female and male tail length and (B) tail length variation (n>=25). (C) Circulating IGF1 concentration and (D) variation in non-fasting and fasting pups (n>=9). ADM: |individual data – median |/median. * p<0.05, ** p<0.01, *** p<0.0001, t test between i.p. metformin-treated and control group of the same sex. In the box plots (A & C), the bottom and top lines of the box represent the minimum and maximum data. The box represents two inner quartiles where 50% of the data resides, and it ranges from the first quartile to the third quartile. The horizontal line in the box represents the median of the data.
