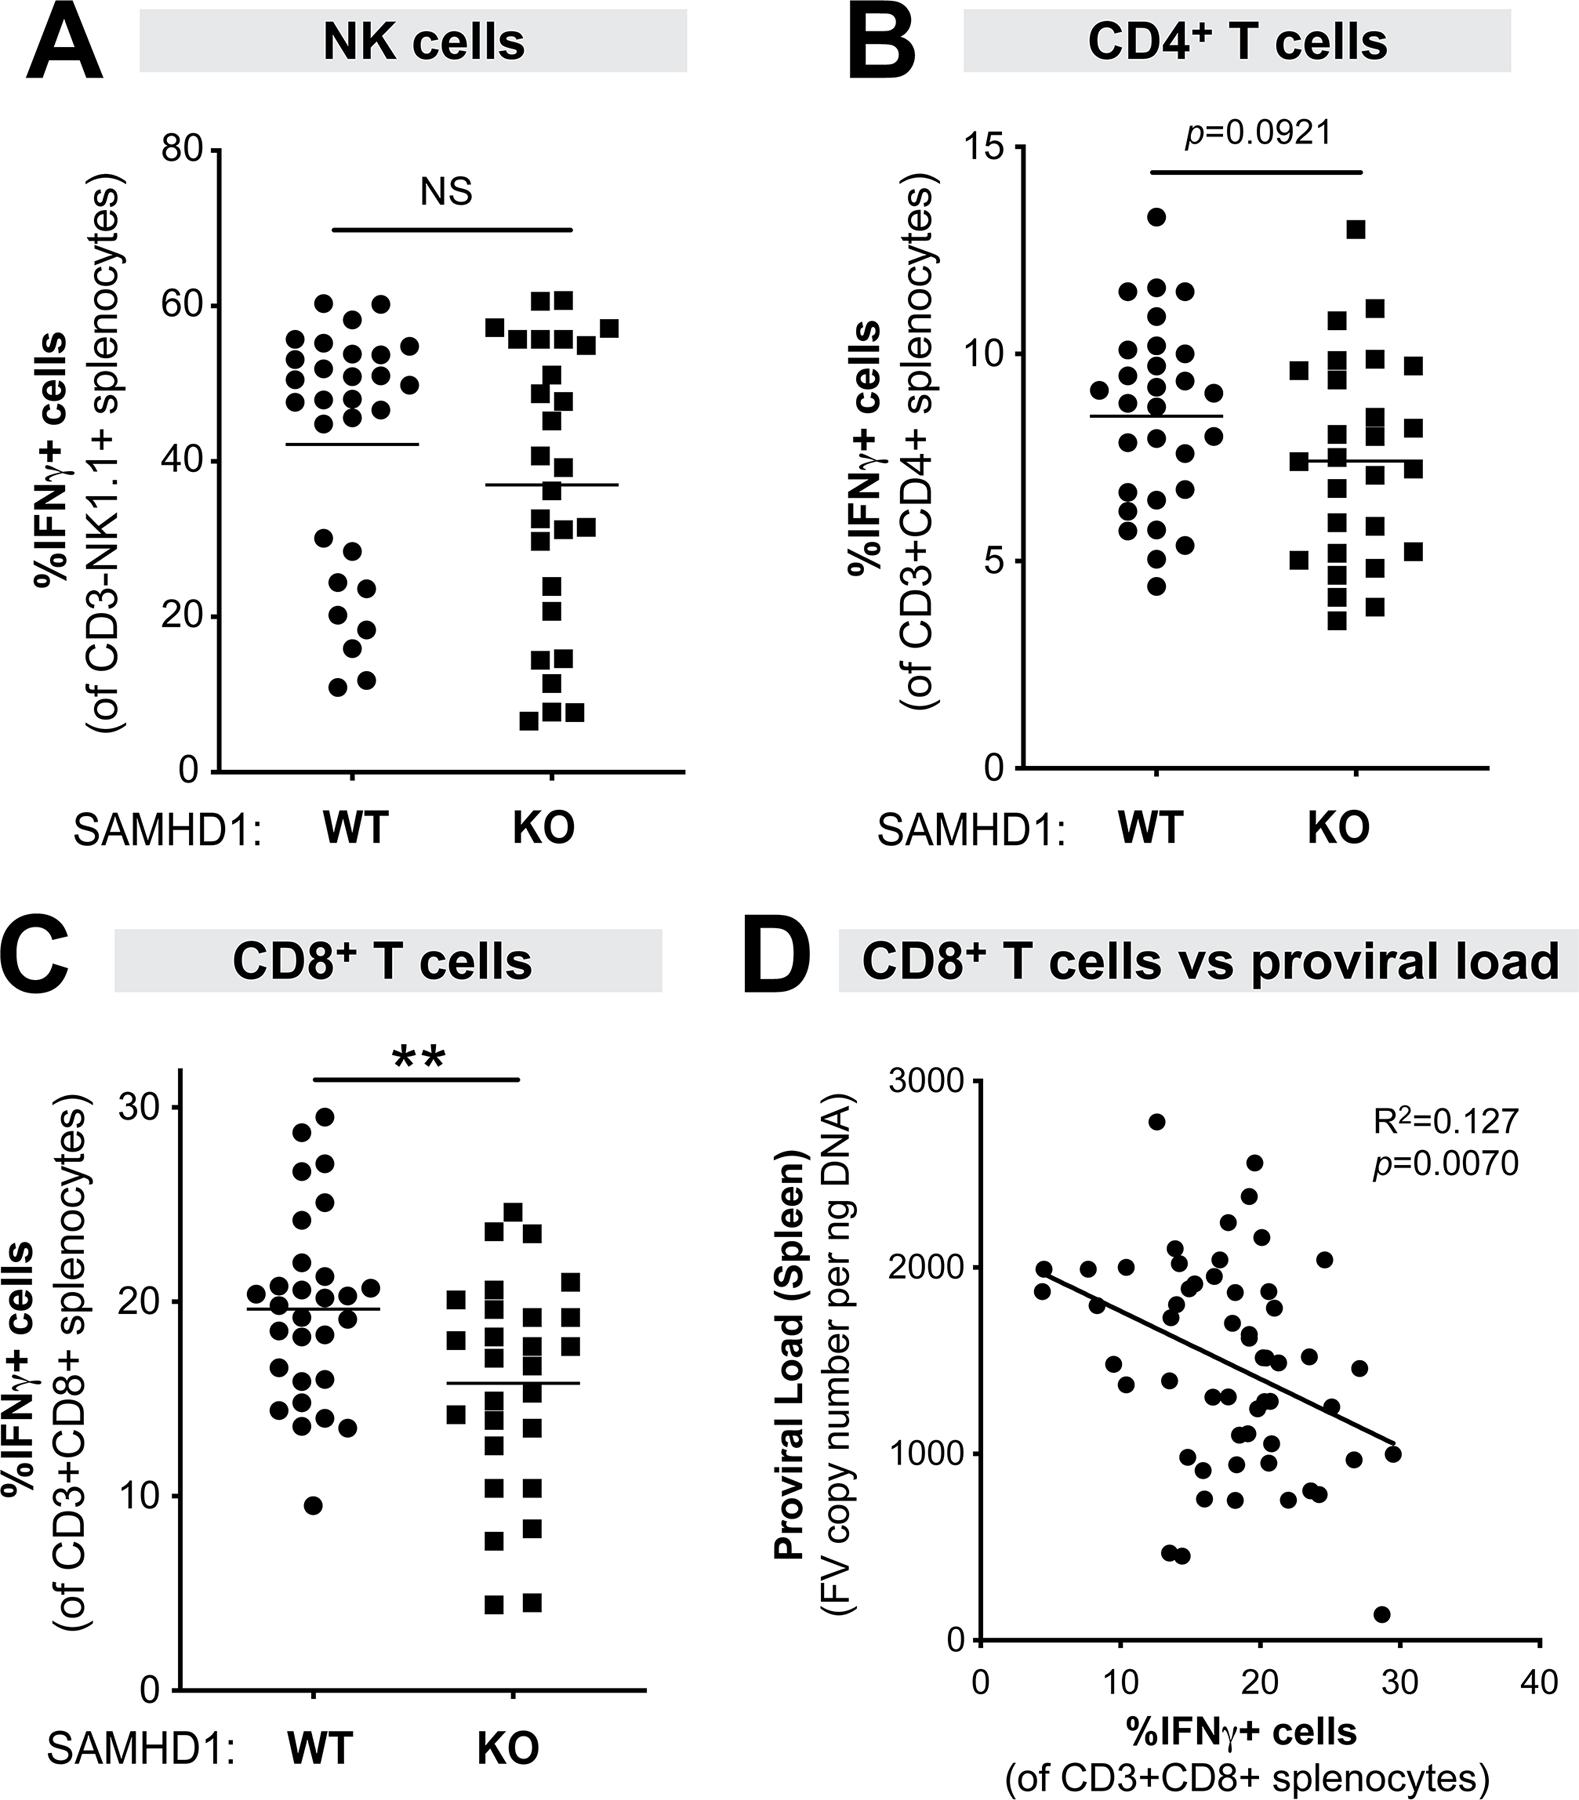
Figure 4.

Cell-mediated immune responses in LPS-treated WT versus SAMHD1 KO mice at 7 dpi. Splenocytes from WT (n=29; 16 males, 13 females) and SAMHD1 KO (n=27; 19 males, 8 females) mice were subjected to flow cytometry using the gating strategy shown in Fig. 1C, evaluating the percentage of IFNγ+ cells in (A) NK cells (CD3-NK1.1+); (B) CD4 T cells (CD3+CD4+) and (C) CD8+ T cells (CD3+CD8+). (D) An inverse correlation was observed between CD8+ T cell responses and splenic proviral DNA load (from Fig. 3A) using linear regression. For all panels, each data point corresponds to a mouse. The data were pooled from 5 independent cohorts of WT and SAMHD1 KO mice. Each experiment consisted of WT (n=5–8) and SAMHD1 KO (n=3–8) mice. For panels A-C, data were analyzed using a 2-tailed unpaired Student’s t-test. **, p<0.01; NS, not significant (p>0.05).
