
Figure 4.
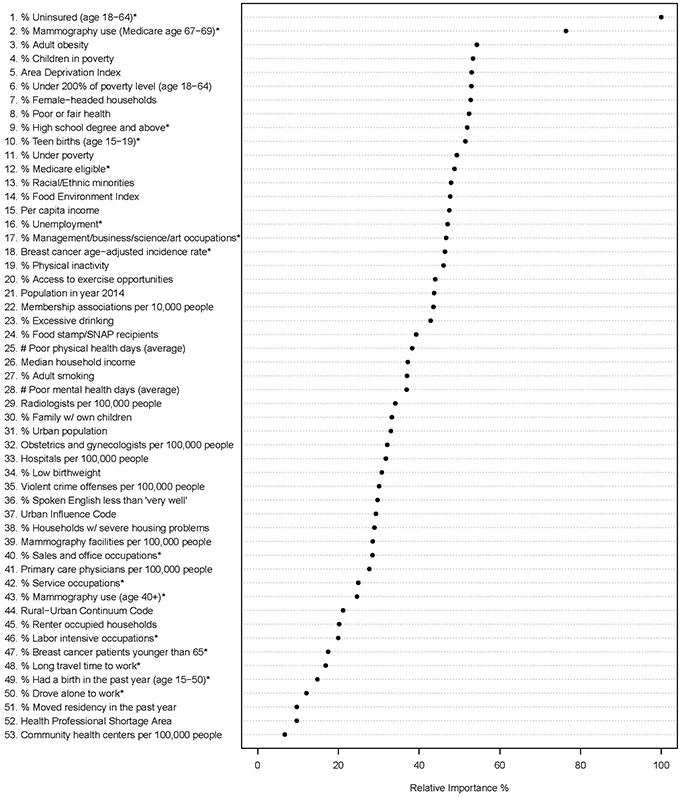
Dot chart of random forest analysis showing variable importance for predicting counties with high proportion of LSBC. The most important variable is at the top and scaled to 100%. The importance of the rest of the variables is shown relative to the top one. The star sign (*) at the end of a variable indicates the variable is specific to females.