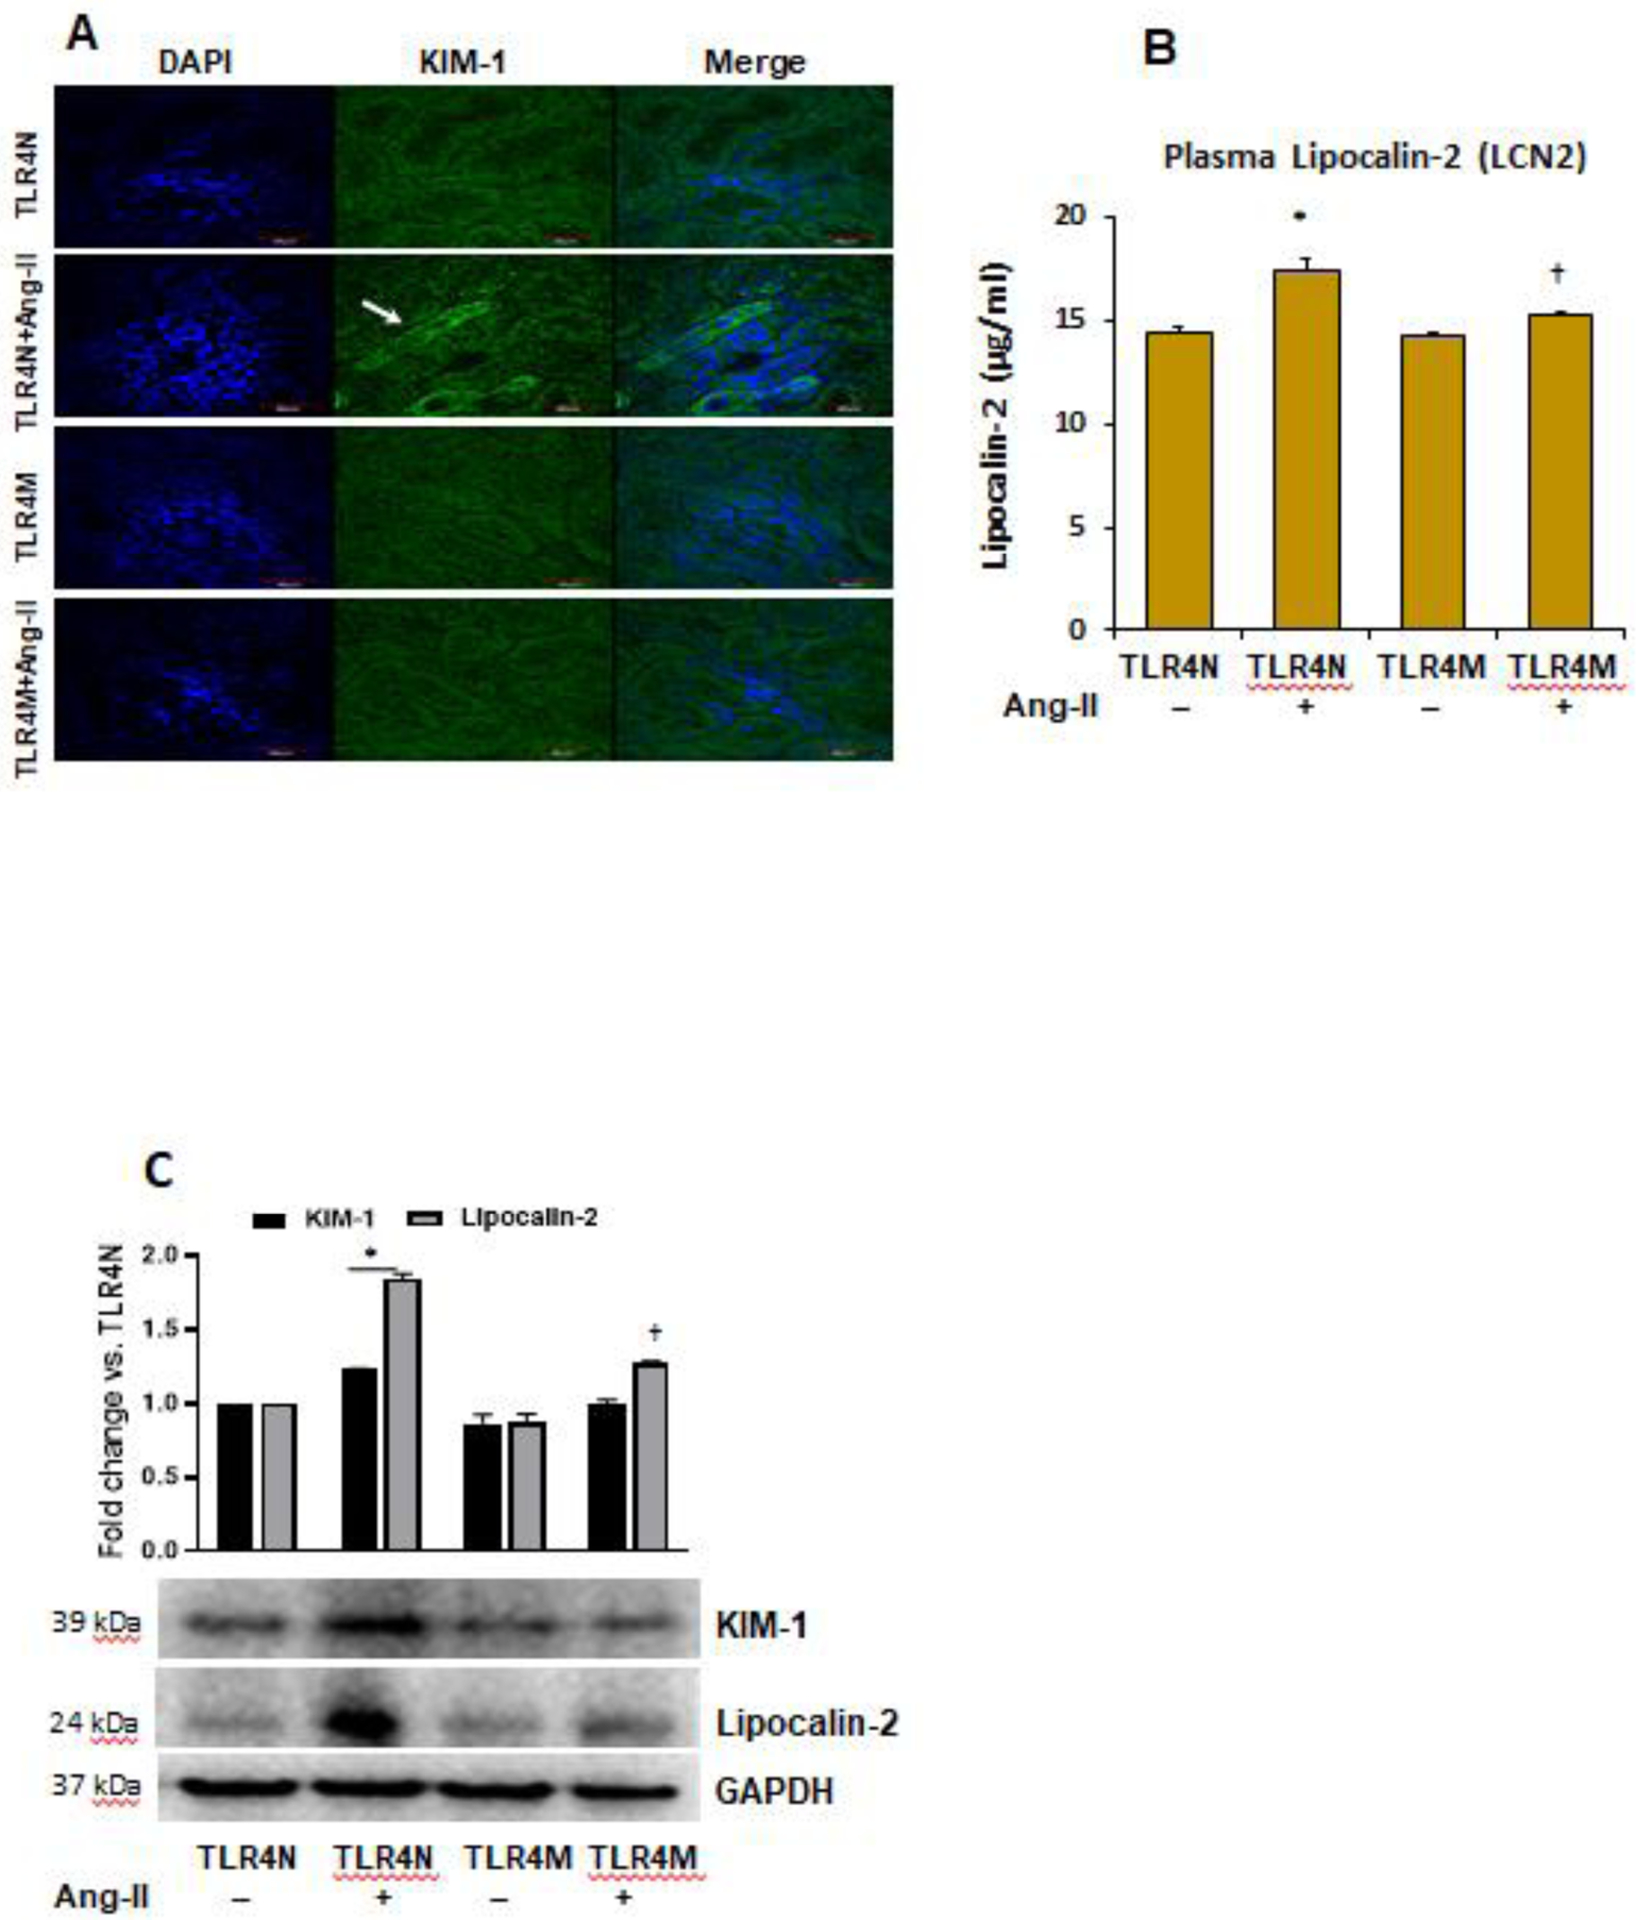
Fig. 7.

TLR4 mutation protected kidney from injury in Ang-II hypertension. (A) Kidney injury molecule-1 (KIM-1) was detected by immunostaining. Representative images from random fields (5 fields/slide/animal). Magnification 60X. Scale bar 40 μM. (B) plasma Lipocalin-2 (LCN2) was measured by ELISA. Data represent mean ± SEM, n=5/saline (control) groups, and n=6/Ang-II treated groups: *P<0.05 vs. TLR4N+saline (control), and †P<0.05 vs. TLR4N+Ang-II. (C) Western blot images of kidney tissue KIM-1 and Lipocalin-2 expression. GAPDH was used as loading control. Bar graphs represent fold change of protein expression. Data presented as mean ± SEM, n=5/saline (control) groups, and n=6/Ang-II treated groups: *P<0.05 vs. TLR4N+saline (control), and †P< 0.05 vs. TLR4N+Ang-II of respective proteins.
