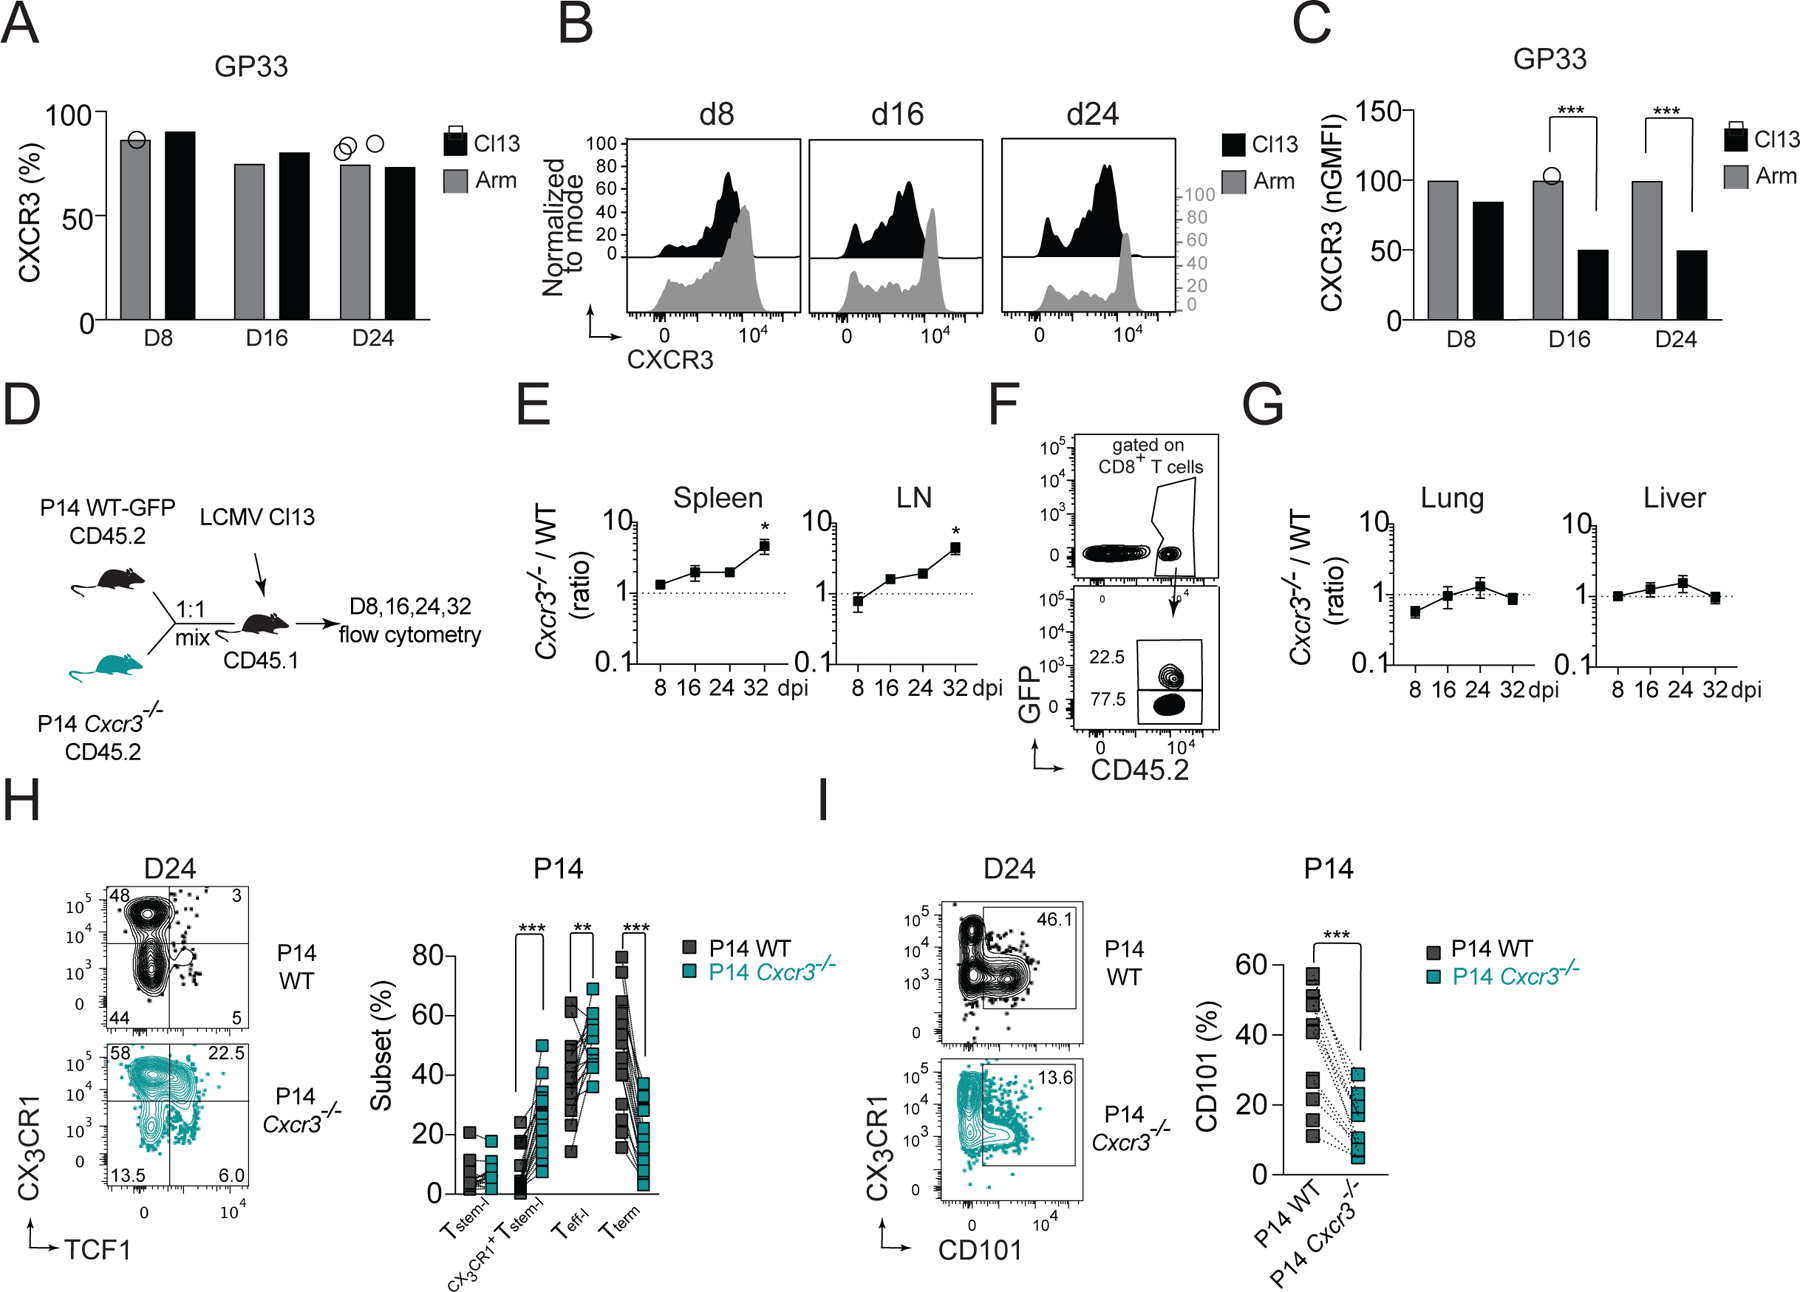
Figure 1. CXCR3 controls the magnitude and heterogeneity of the LCMV-specific CD8+ T cell response in cell intrinsic manner.

(A-C) Kinetics of CXCR3 expression on splenic GP33-specific cells isolated from C57BL/6 WT mice during acute (Arm) and chronic (Cl13) infection. Percentage of CXCR3+ cells among GP33-specific cells (A); flow cytometry histograms of CXCR3 expression on GP33-specific cells (B), and amount of CXCR3 expression on GP33-specific cells (normalized to Arm) (C). (D-I) CD45.1 mice received an adoptive transfer of 1:1 mixture of CD45.2 positive GFP+ WT P14 and Cxcr3−/− P14 cells followed by infection with Cl13. (D) Experimental scheme. (E-G) The ratio of Cxcr3−/−/WT P14 cells recovered from spleen and LNs (E) with exemplary gating of transferred cells on d24 (F), or the ratio of Cxcr3−/−/WT P14 cells recovered from parenchyma of liver and lung (G) pi. with Cl13. (H-I) Frequency of T cell subsets based on the expression of TCF1 and CX3CR1 among WT and Cxcr3−/− P14 cells (H) and frequency of CD101+ P14 cells (I) in spleens on d24 pi. with Cl13. Data are from at least two independent experiments (n=3–4 per time point). Data in A, C and H were analyzed with an ordinary one-way Anova test with Sidak’s multiple comparison test; data in E and G with Dunnett’s multiple comparison test; and data in I with paired Student’s t-test; *, P < 0.05; **, P < 0.01; ***, P < 0.001. See also Figure S1.
