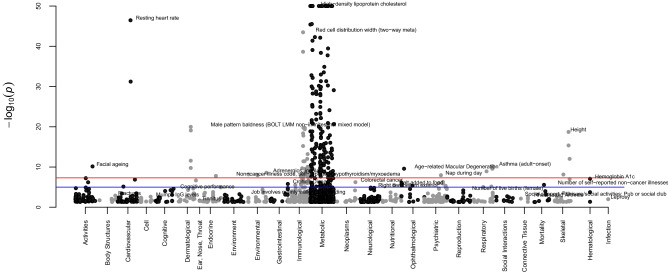
Figure 5.
Results of the phenome-wide association study of the six genetic determinants of the blood pressure related phospholipids. In each domain (x-axis), the top trait was annotated in the figure. The traits with P-value level less than 1.0 × 10−50 were annotated as 1.0 × 10−50 in the figure. The dots depict the P-values from either rs174576, rs10468017, rs261338, rs12439649, rs740006 and rs7337573 which are located in the protein-coding genes TMEM258, FADS2, ALDH1A2, LIPC, and antisense gene RP11-355N15.1.

