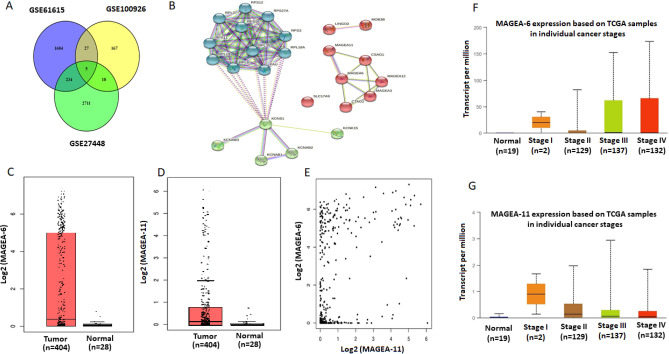
Figure 1.
Bioinformatic analysis of bladder cancer studies in online different databases. (A) The Venn diagram by Venny (https://bioinfogp.cnb.csic.es/tools/venny/index2.0.2.html)66 represents the overlaps of differential protein expressions between three subtypes of BC. Five common differential expressions genes (LINGO2, SLC17A9, KCNS1, MAGEA6, and MAGEA11) were obtained from the GEO database, including GSE61615, GSE27448, and GSE100926. (B) PPI via STRING (https://string-db.org/)69 of common differential protein expressions was obtained by the string with the highest degree of connectivity (highest confidence > 0.9) in three GEO databases of BC. (C) The Box plot expression results of the BC Match TCGA normal and GTEx data showed that increased expression of MAGE-A6 protein on GEPIA database (p < 0.05, |Log2FC| Cutoff: 2) (http://gepia.cancerpku.cn/index.html)73. (D) The Box plot expression results of the BC Match TCGA normal and GTEx data showed that increased expression of MAGE-A11 protein on GEPIA database (p < 0.05, |Log2FC| Cutoff: 2) . (E) The Co-expression results of genes predicted by the GEPIA database online analysis showed that there is a statistically significant spearman correlation between MAGE-A6 and MAGE-A11 protein in BC and normal based on TCGA samples (Log-rank test; P = 4e-23). (F) Box plot analysis of the relative expression levels of MAGE-A6 in normal tissues and BC patient’s individual cancer stage (I-IV) tissues by UALCAN database (http://ualcan.path.uab.edu/)72. Based on the standard definitions, each box-plot shows the median (bold line) and interquartile lines (box). The result of Mann–Whitney U test showed that there is an association for the median of expression between Normal-vs-Stage2 (p = 2.541000E-03), Normal-vs-Stage3 (p = 4.42790000000359E-05), Normal-vs-Stage4 (p = 1.189250E-04), Stage2-vs-Stage3 (p = 1.790020E-01), Stage2-vs-Stage4 (p = 2.900000E-01), Stage3-vs-Stage4 (p = 7.813600E-01), and there were no statistically significant differences in the median level of MAGE-A6 mRNA expression between Stage1-vs- Normal and the other stages. (G) Box plot analysis of the relative expression levels of MAGE-A11 in normal tissues and BC patient’s individual cancer stage (I-IV) tissues by UALCAN database. Based on the standard definitions, each box-plot shows the median (bold line) and interquartile lines (box). The result of Mann–Whitney U test showed that there is an association for the median of expression between Normal-vs-Stage1 (p = 4.896000E-01), Normal-vs-Stage2 (p = 2.821200E-03), Normal-vs-Stage3 (p = 1.76258999999845E-05), Normal-vs-Stage4 (p = 4.155100E-04), Stage1-vs-Stage2 (p = 7.867800E-01), Stage1-vs-Stage3 (p = 6.622000E-01), Stage1-vs-Stage4 (p = 7.758200E-01), Stage2-vs-Stage3 (p = 2.979400E-01), Stage2-vs-Stage4 (p = 5.875000E-01), Stage3-vs-Stage4 (p = 7.793800E-02). BC: bladder cancer, GEPIA: gene expression profiling interactive analysis web server, GTEx: genotype-tissue expression project PPI: protein protein interaction, TCGA: the cancer genome atlas.

