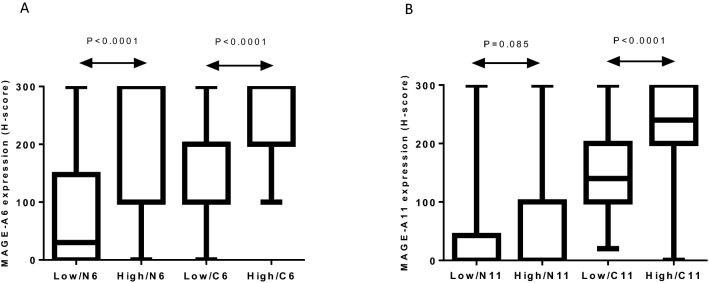
Figure 3.
Differences of expression of MAGE-A6 (A) and MAGE-A11 (B) in low grades vs high grades of BC samples with immunohistochemical analysis (Mann–Whitney U test). C6: cytoplasmic expression of MAGE-A6, C11: cytoplasmic expression of MAGE-A11, high: high grade, low: low grade, N6: nuclear expression of MAGE-A6, N11: nuclear expression of MAGE-A11, P: p-value. Charts were drawn by Prism version 8.3.0 software (Graph Pad Inc., San Diego, CA, USA). https://www.graphpad.com/support/faq/prism-830-release-notes/.

