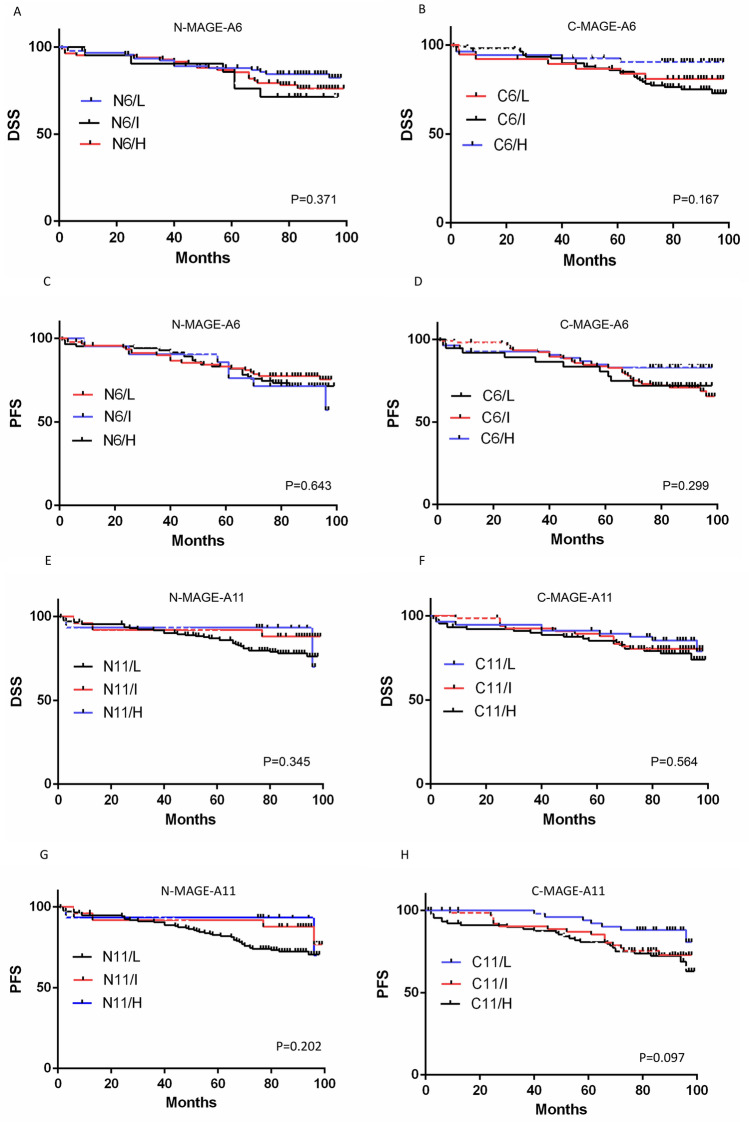
Figure 4.
Survival analysis for MAGE-A6 expression (A-D) and MAGE-A11 (E–H) in BC patients (Kaplan–Meier analysis). The number of patients in the analyzed groups is as follows: For DSS in N6/L group: 93 (censored (C) = 78 and death (D) = 15) , N6/I : 21 (C = 15 and D = 6), N6/H : 85 (C = 66 and D = 19), C6/L: 38 (C = 31 and D = 7), C6/I : 107 (C = 80 and D = 27), and C6/H : 54 (C = 48 and D = 6). For PFS in N6/L group: 93 (C = 72 and D = 21), N6/I : 21 (C = 14 and D = 7), N6/H : 85 (C = 62 and D = 23), C6/L: 38 (C = 28 and D = 10), C6/I : 107 (C = 75 and D = 32), and C6/H : 54 (C = 45 and D = 9). For DSS in N11/L group: 172 (C = 135 and D = 37), N11/I: 25 (C = 22 and D = 3), N11/H :16 (C = 14 and D = 2), C11/L: 57 (C = 48 and D = 9), C11/I: 67 (C = 54 and D = 13), and C11/H : 89 (C = 69 and D = 20). For PFS in N11/L group: 172 (C = 125 and D = 47), N11/I : 25 (C = 21 and D = 4), N11/H : 16 (C = 14 and D = 2), C11/L:57 (C = 45 and D = 12), C11/I : 67 (C = 52 and D = 15), and C11/H : 89 (C = 63 and D = 26). C: cytoplasm, C6: cytoplasmic expression of MAGE-A6, C11: cytoplasmic expression of MAGE-A11, DSS: disease-specific survival, H: high expression, I: intermediate expression L: low expression, N: nuclear, N6: nuclear expression of MAGE-A6, N11: nuclear expression of MAGE-A11, P: p-value, PFS: progression free-survival. Charts were drawn by Prism version 8.3.0 software (Graph Pad Inc., San Diego, CA, USA). https://www.graphpad.com/support/faq/prism-830-release-notes/.

