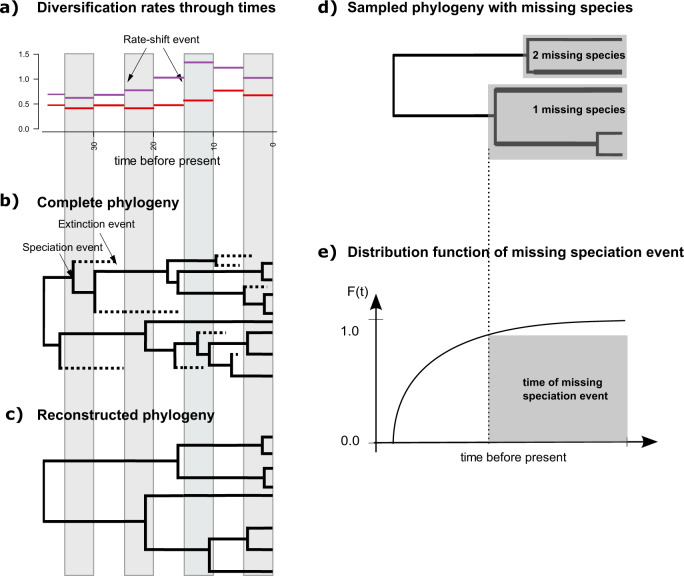
Fig. 4. Cartoon of the birth–death process with rate-shift events and empirical taxon sampling.
a Depiction of the speciation (purple lines) and extinction (red lines) rates through time. Here we assume that speciation and extinction rates are episodically constant, that is, diversification rates shift instantly and only at the beginning of an episode. Each episode lasts five time units in this example. b A realization (complete phylogeny) of the birth–death process. Lineages that have no extant or sampled descendant are shown as dashed lines and surviving lineages are shown as solid lines. c Reconstructed phylogeny corresponding exactly to the one shown in B with the extinct lineages pruned away. Thus, plot c depicts the “observed” phylogeny from which the speciation times are retrieved. d Sampled phylogeny with gray boxes depicting named clades with known number of missing species. The phylogeny is the same as in c with fewer taxa. e Distribution function of the time of the missing speciation event. The missing speciation event could have occurred any time between the crown age of the named clade and the present time (gray box). The distribution function is integrated over and hence the uncertainty of the missing speciation event accounted for.

