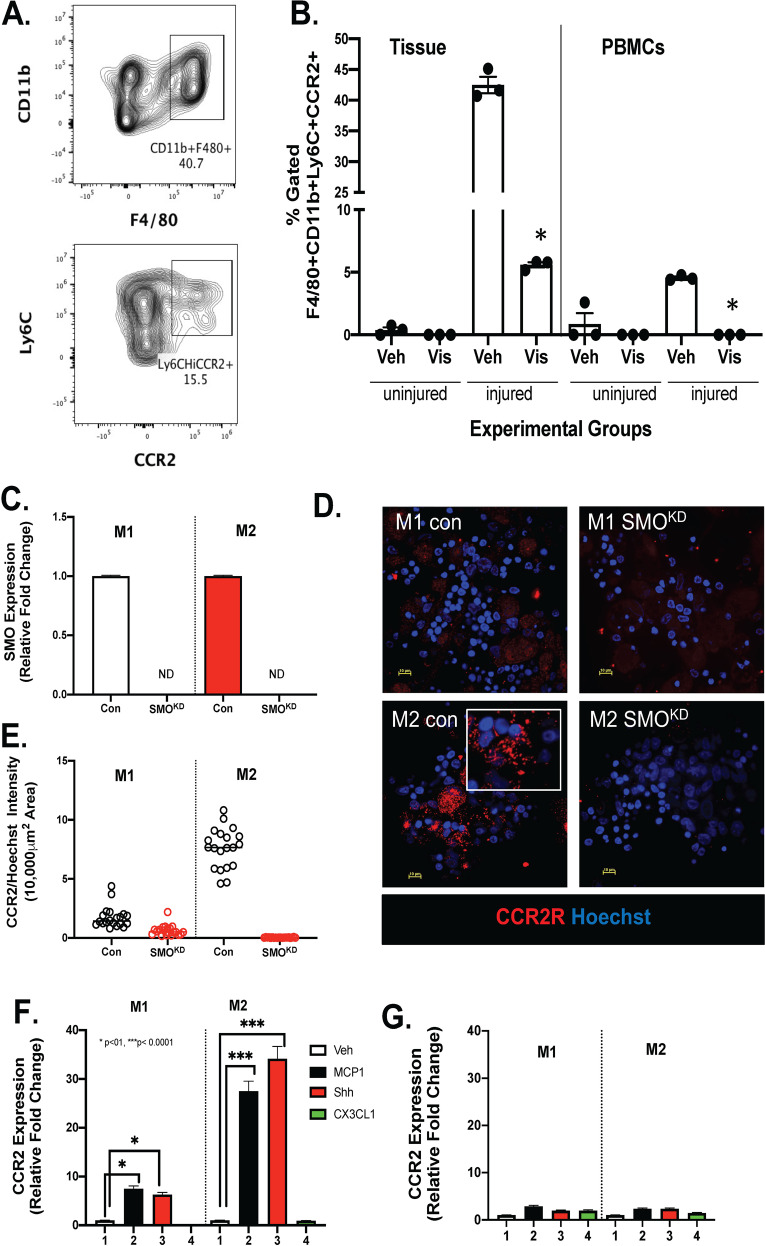
Fig. 8. Changes in CCR2 in mouse and human monocytes in response to Smo chemical inhibition or gene knockdown.
A Flow cytometric contour plots demonstrating the gating strategy for quantification of CD11b+F4/80+Ly6CHiCCR2+ macrophages. B Quantification of flow cytometry analysis for the expression of CD11b+F4/80+Ly6CHiCCR2+ macrophages within tissues and PBMCs collected in response to acetic acid-induced injury. Uninjured controls were subjected to surgery and stomachs exposed to PBS. C Quantitative RT-PCR documenting knockdown of Smoothened (SMOKD) in human-derived monocyte cultures. D Immunofluorescence of M1 or M2 macrophages in control and SMOKD cultures for CCR2 expression (red). E Fluorescence intensity was measured using images captured in (D). Quantitative RT-PCR using RNA collected from (F) control and (G) SMOKD cultures polarized to either M1 or M2 macrophages and treated with vehicle (Veh), MCP-1, Shh, or CX3CL1. *P < 0.05 compared to control or vehicle groups, n = 3 individual biological replicates. Data are shown as the mean ± SEM.

