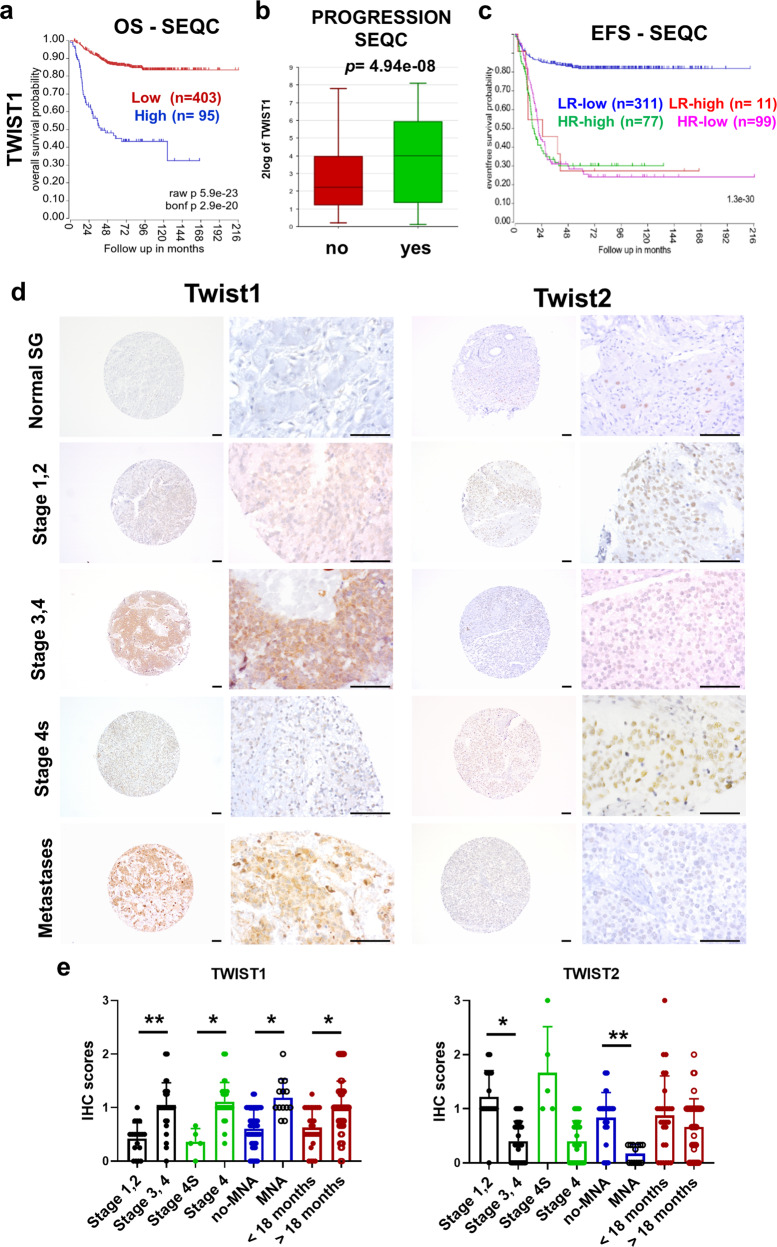
Fig. 1. TWIST1 RNA expression is associated with poorer outcome of NB patients and displays an opposite protein expression profile in a NB tissue microarray.
a−c Analysis of TWIST1 expression in the SEQC dataset of primary NB tumors. a Kaplan−Meier OS curve associated with TWIST1 expression. Expression cutoff: 44.441. b Box-and whisker plots showing the expression of TWIST1 in relation to disease progression. c Kaplan−Meier EFS curves showing the stratification of patients of the SEQC dataset according to the risk classification (high-risk: HR; low-risk: LR) and TWIST1 expression (high or low). d TWIST1 and TWIST2 protein expression was analyzed by IHC using a NB TMA containing 97 tumor sections: 72 primary tumors, 25 matched metastases and 44 matched control normal tissues, adrenal glands, and sympathetic ganglia (SG). Representative images of TWIST1 and TWIST2 IHC staining are shown for each indicated category. Magnification 100× (left panels) and 400× (right panels); scale bares = 100 µm. e Graphs showing the individual IHC scores of TWIST1 and TWIST2 per tumor and the mean ± SD for different comparisons (see Supplementary Table 1). Statistical analysis was done using parametric Student’s t-test.

