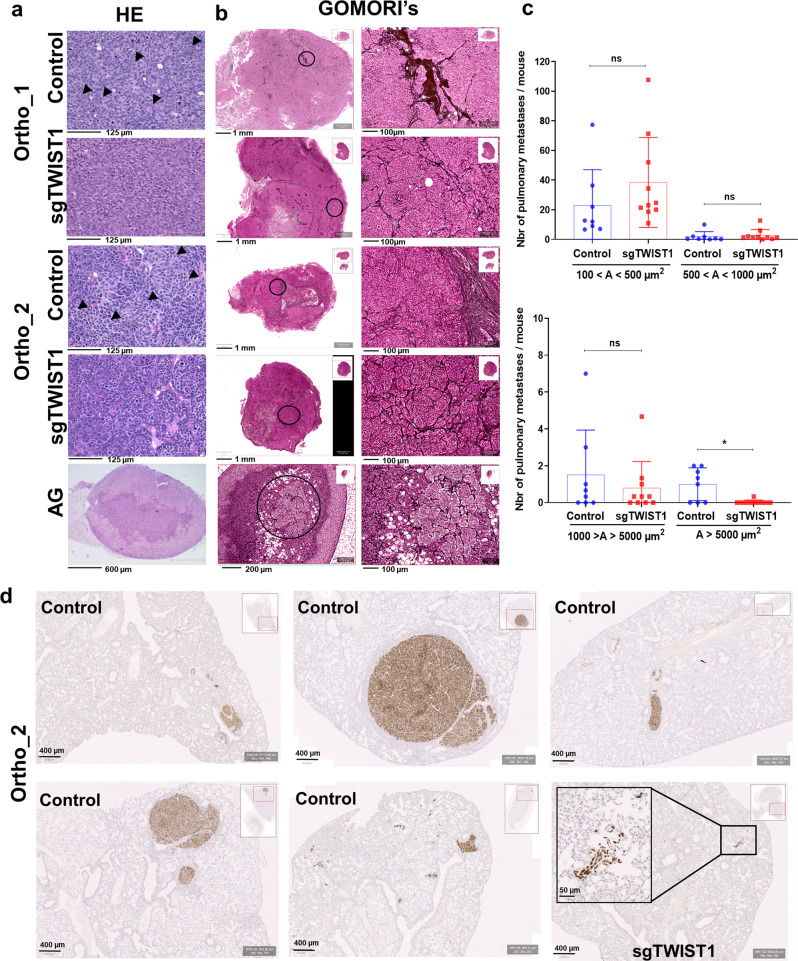
Fig. 3. TWIST1 KO produces tumor with a less aggressive phenotype and impairs the formation of the intrapulmonary macrometastases.
a Representative images of H&E staining of ortho tumors and AG. H&E staining of both ortho-derived tumors depicted cells in Control tissues separated by thin fibro-vascular septs having irregular size and shape; no discernable/scarce cytoplasm; one or few prominent nucleoli; spindle-shaped cells with fusiform nuclei (black arrow) that tended to have a fascicular organization. Conversely, sgTWIST1 tumor cells were portrayed by a more regular size and shape (round to oval) with only slight irregularities, finely granular (“salt-and-pepper”) chromatin, small nucleoli, and moderate/more discernible cytoplasm (scale bar: 125 µm for tumors; 600 µm for AG). b Representative images of Gomori’s staining showing the architecture of the collagen III/reticulin fibers in ortho tumors and AG, scale bars: 1 mm and 200 µm, respectively; and zoomed view of the region highlighted by a black circle, scale bars: 100 µm for both tumors and AG. c Quantification of metastases detected by IHC with the Alu positive probe II within the parenchyma (intrapulmonary) of mice (n = 8 mice for Control, n = 10 for sgTWIST1). Data are plotted in a bar graph showing individual values and mean ± SD for micrometastases (upper panel: 100−500 µm2: p = 0.1120; 500−1000 µm2: p = 0.3705) and for macrometastases (lower panel: 1000−5000 µm2, p = 0.5724; >5000 µm2, *p = 0.0178). Mann−Whitney test. Percent of mice with macrometastases = 62.5% in the Control group; 10% in the sgTWIST1 group (p = 0.043 Fisher’s exact test). d Representative images of Alu positive probe II staining of lungs of the 5 Control and 1 sgTWIST1 ortho_2 mice with pulmonary metastases A > 105 µm2.

