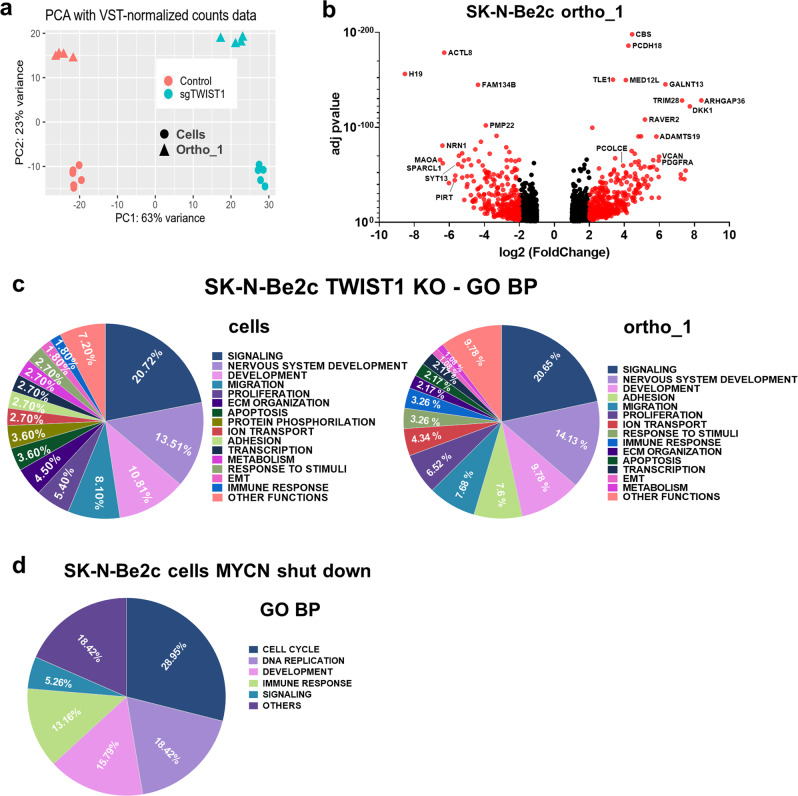
Fig. 4. The biological pathways deregulated by TWIST1 KO are distinct from those mediated by MYCN shut down.
a PCA samples repartition using the VST-normalized counts. PCA1 and PCA2 are 63% and 23% of total variation, respectively. b Volcano plots showing the distribution of the DE genes according to FC (log2) and adj p value between the SK-N-Be2c-Control and –sgTWIST1 ortho_1-derived xenografts. Genes with False Discovery Rate (FDR) < 0.05 and absolute value (av) of log2(FC) ≥ 1 were considered as DE; in red genes with av of log2(FC) ≥ 2, in black genes with av of log2(FC) ≥ 1 and <2. Positive and negative x-values represent genes either up- or downregulated by TWIST1, respectively. c Illustration of the biological processes gene sets found enriched by GO analyses (GO BP) in the DE genes following TWIST1 KO for both SK-N-Be2c cells (left panel) and ortho_1 tumors (right panel). Data are reported as the repartition (in %) of the diverse pathways identified with a FDR < 0.01 (n = 111 for cells, n = 92 for tumors). d Illustration of the GO BP gene sets found enriched in the DE genes in SK-N-Be2c cells upon JQ1-mediated MYCN shutdown. RNAseq data of SK-N-Be2c cells treated with JQ1 during 24 h or DMSO as control were uploaded (GSE80154, see “Methods”)17. Genes with False Discovery Rate (FDR) < 0.05 and absolute value (av) of log2(FC) ≥ 1 were considered as DE. Data are reported as the repartition (in %) of the diverse pathways identified with a FDR < 0.01 (n = 38).

