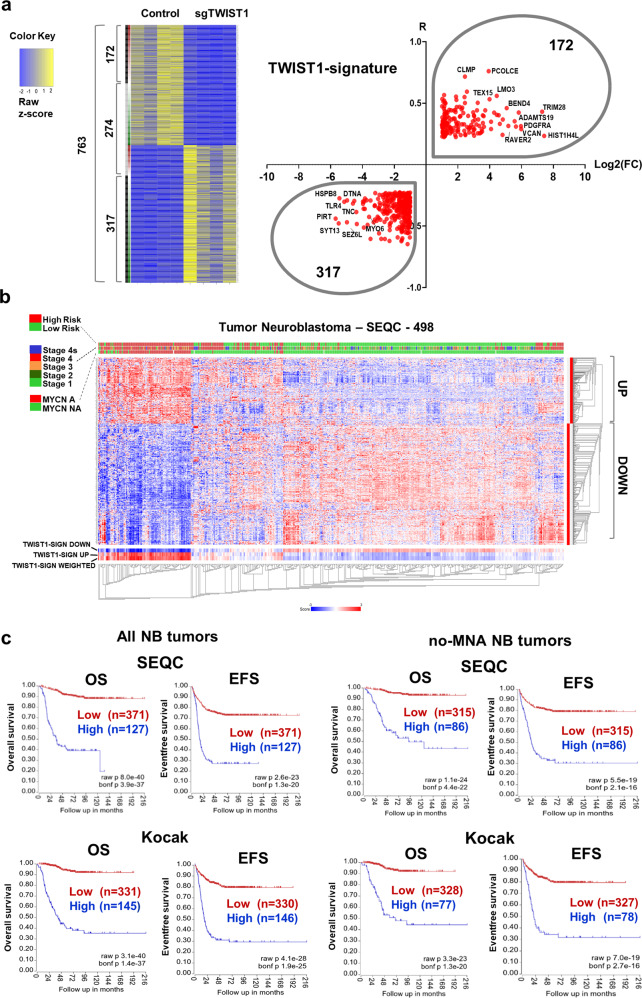
Fig. 5. Identification of a TWIST1-associated gene signature correlating with poor prognosis in NB.
a Heatmap showing 763 common genes either correlated or anticorrelated with TWIST1 in NB patients and DE in the ortho_1 tumors, and volcano plot showing the distribution of the 489 genes of the TWIST1-signature according to their log2(FC) in SK-N-Be2c ortho_1 tumors and R values in the SEQC dataset. The binary side color bar going from green to red indicates DE genes anti-correlated (R < −0.225, green) or correlated (R > 0.225, red) with TWIST1 in the SEQC dataset. The black bar shows the genes that have both FC and R values either positive or negative representing the TWIST1-signature, and the gray bar the genes that have opposite FC and R values (not included in the signature). b Heatmap hierarchical clustering showing different expression pattern relative to TWIST1-signature genes generated using the R2 Platform (http://r2.amc.nl). Columns represent patients annotated in the SEQC cohort; the 489 genes are clustered hierarchically along the left y-axis. Clinical criteria taken into consideration (risk groups, tumor stages, and MYCN amplification status) are indicated on the top by color codes. The heat map indicates in red, blue, and white a high, low, and a medium level of gene expression (z-score), respectively. The blue-white-red color bars depicted at the bottom of the heatmap represent the z-score of TWIST1_Up and TWIST1_Down gene sub-lists of the signature, as well as for the z-score of the whole signature (weighted). c Kaplan−Meier OS and EFS survival curves according to the expression level of the TWIST1-signature in both the SEQC and Kocak datasets, in the complete cohorts and in sub-cohorts of patients without MNA (no-MNA). Expression cutoff in the SEQC: 0.20 for OS curves; −0.05 for EFS curves. Expression cutoff in the Kocak: 0.03 for all curves.

