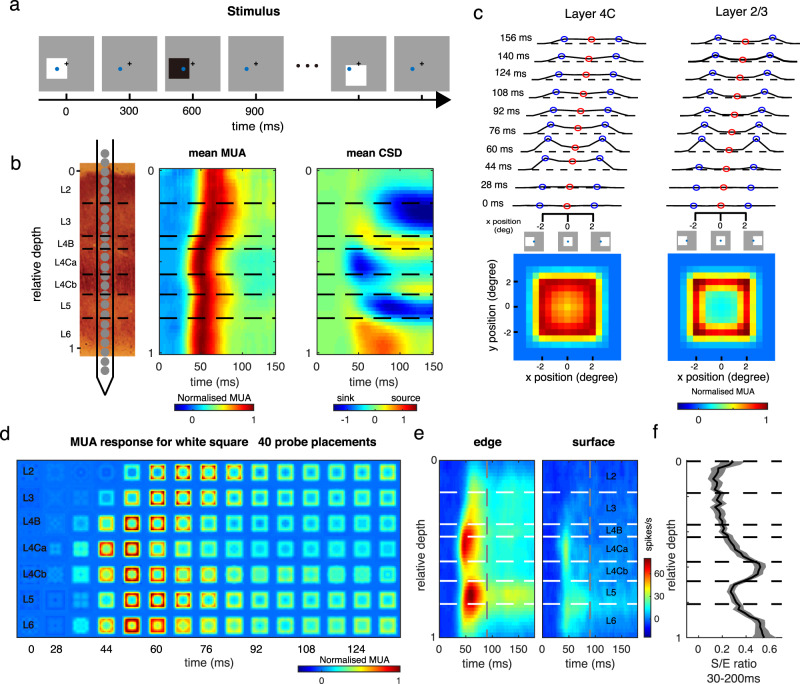
Fig. 1. Cortical presentation of surface and edge in V1 layers.
a Stimulus paradigm. During a trial in the fixation task, 4 × 4° black and white squares were presented, one by one, at random locations on a gray screen. Each black or white square was presented for 300 ms and followed by 300 ms blank condition. The squares had either negative contrast or positive contrast (90%) relative to the background luminance. The black plus and blue circle represent the fixation point location and a recorded site’s receptive field (RF). b Laminar recording and assignment. Left panel: The linear array (U-Probe, Plexon, 24 channels, interchannel spacing 100 μm) was positioned vertically through the full depth of V1. Middle and right panel: Laminar pattern of MUA and CSD averaged overall probe placements. Horizontal black dashed lines indicate the laminar boundaries in V1. c Dynamic of neural responses to different positions of a white square in layer 2/3 (the left panel) and layer 4 C (the right panel). response curves were plotted every 16 ms, from 28 ms to 156 ms after stimulus onset. Blue points represent the responses to the square edge. Red points represent the responses to the center of the square. Dashed lines indicate the responses to a blank stimulus. Lower panels: Spatial response patterns in layer 2/3 and layer 4 C averaged over time. d The plot consists of 7*17 square-like response patterns as in c (averaged between 40 probe placements). Each one of these patterns represents a snapshot of normalized population-averaged responses (MUA) to different positions of a white square at a particular time interval (columns: with an 8 ms time window) and at different cortical layers (rows: layers 2, 3, 4B, 4Ca, 4Cb, 5, and 6, respectively). Responses were normalized with peak response of each layer and was coded by color. e Laminar pattern of the neuronal response to stimulus edge (left) and surface (right). f Solid curve and shading represent mean ± s.e.m. of S/E ratio (ratio of surface response to edge response) smoothed by a window at 0.08 units at each cortical depth, n = 630. Source data are provided as a Source Data file.

