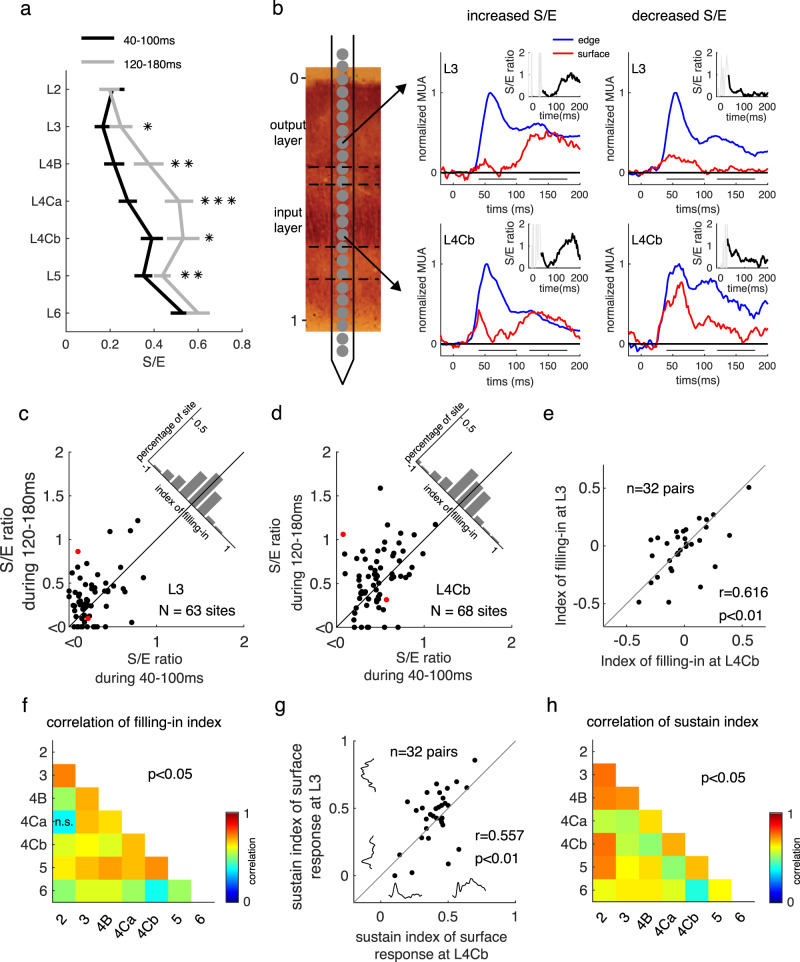
Fig. 2. Dynamics of surface responses across V1 layers and their relationship.
a Ratio between surface response and edge response (S/E) at 40–100 ms and at 120–180 ms after stimulus onset in different layers, averaged across sites from the 18 probe placements with increased S/E in output layer 3 or 4B. S/E ratios are presented as mean ± s.e.m. *p < 0.05, **p < 0.01, ***p < 0.001, one-sided paired t-test, n = 29, 32, 20, 34, 27, 41, 42 sites in layers from L2 to L6, respectively. b Two examples of dynamic MUA responses to square surface (red lines) and edge (blue lines) at output and input layer are simultaneously recorded in the same probe placement. The first example (mid-column) shows that the S/E ratio in both input and output layer increased over time in a probe placement. The other example shows that the S/E ratio in both input and output layer (right column) decreased over time in another probe placement. The early response period and the late response period were marked as solid lines in each plot. Dark lines in insets represent the dynamics of the S/E ratio from 40–200 ms. c, d Scatter plot for S/E ratio at the early time versus late time for all recorded sites at the output layer and the input layer. Red dots in figure c and d is calculated from data shown in panel b. e Correlation of filling-in strength between sites at L4Cb (x-axis) and sites at L3 (y-axis) simultaneously recorded from the same probe placement. n = 32 pairs, Pearson’s r = 0.616, p = 0.0002. f Pearson’s correlation of filling-in strength among simultaneously recorded sites at different V1 layers. p < 0.05 except the one marked with n.s. for p = 0.091. g Correlation of surface response sustainability between sites at L4Cb (x values) and sites at L3 (y values) simultaneously recorded from the same probe placement. n = 32 pairs, Pearson’s r = 0.557, p = 0.0009. h Pearson’s correlation of surface response sustainability among simultaneously recorded sites at different V1 layers. All p-values are <0.05. Source data are provided as a Source Data file.

