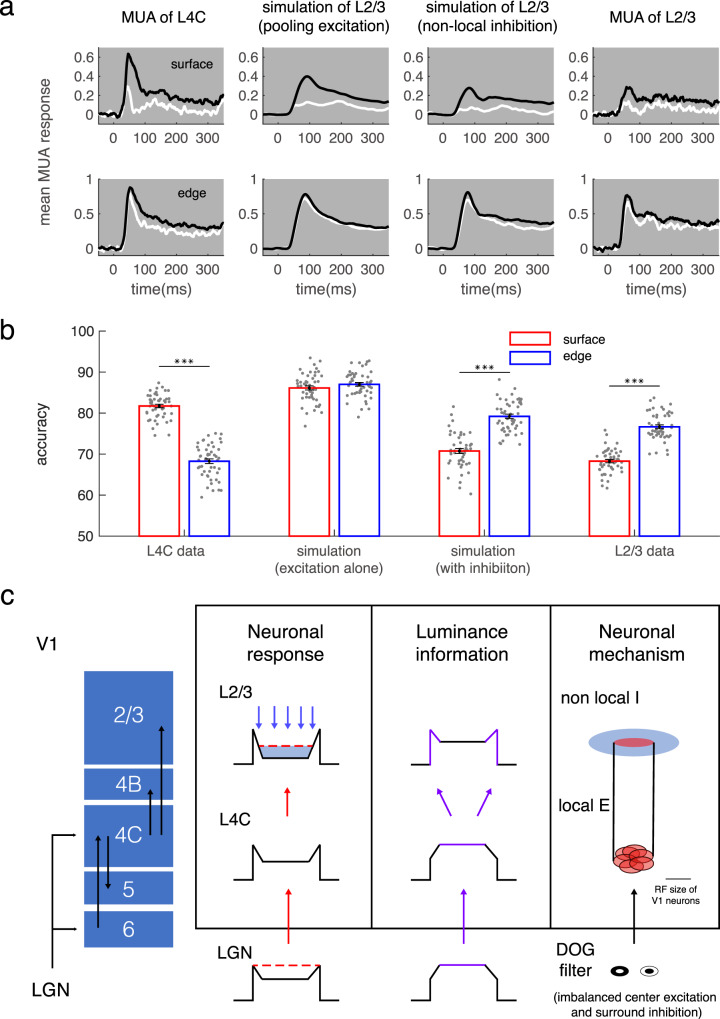
Fig. 7. The cortical mechanisms for switching coding strategy of surface luminance.
a Population-averaged dynamic response (shading for ±s.e.m.) to surface (upper row) and edge (lower row) of black and white squares in L4C (first column), in model A for L2/3 (second column), in model B for L2/3 (third column), and in L2/3 (fourth column). b Decoding performance for surface luminance under the 4 conditions in a. The number of sites for each decoder was kept constant at 32. ***p < 0.001, two-sided paired t-test. Bars show mean accuracy across populations (±s.e.m., n = 50), with individual data superimposed. c Schematic illustration for changes of neuronal responses and coding strategy for luminance information. Neurons in L2/3 integrate pooled projection, illustrated by red arrows, from L4C in a small cortical range and are modulated by inhibition, shown by blue arrows, in a more comprehensive cortical range. The surface luminance information was illustrated by purple color in the ‘luminance information’ column. Source data are provided as a Source Data file.

