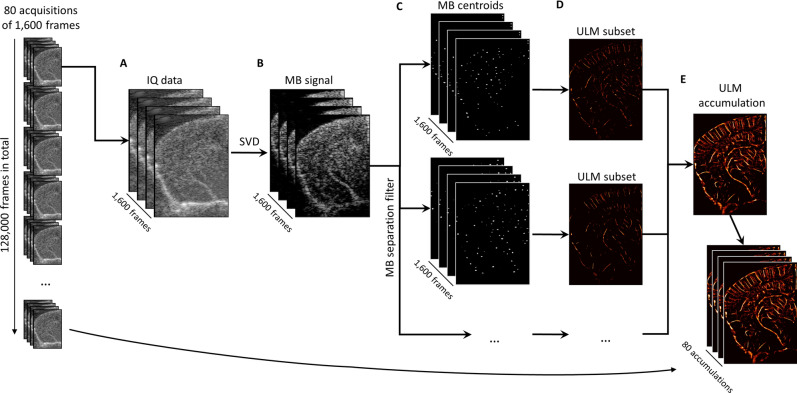
Figure 2.
Super-resolution reconstruction workflow. (A) Each 1,600 frame IQ data acquisition was represented as a 3D matrix of stacked imaging frames. This was then reshaped into a Casorati matrix and an (B) SVD filter was applied to extract the moving microbubble signal from the highly spatiotemporally coherent tissue background. (C) A microbubble separation filter was then applied to split the high concentration microbubble dataset into sparser subsets, each of which were independently processed. The microbubble locations were detected on each subset using a 2D normalized cross-correlation with an empirically determined PSF function. (D) The uTrack algorithm was then applied on detected centroids to pair microbubbles and estimate trajectories. (E) The final reconstruction for this 1,600 frame dataset was produced by combining each of the independently processed data subsets. Images were rendered using MATLAB (R2019a, https://www.mathworks.com/).

