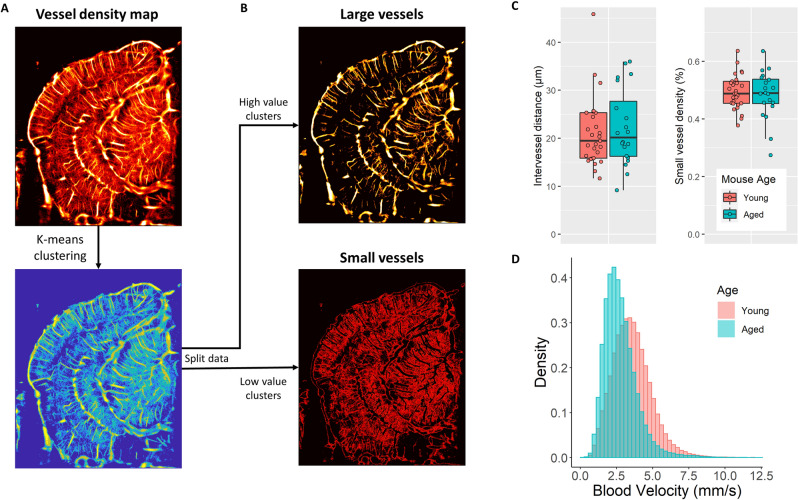
Figure 4.
ULM image clustering and distributional analysis. (A) Super-resolution vessel maps were clustered based on microbubble accumulation density using K-means clustering with 6 clusters. (B) Splitting the clustered map into separate high-valued and low-valued images allowed for the generation of large vessel and small vessel representations of the ULM data, respectively. (C) The mean intervessel distance across the entire coronel hemisphere for the large vessel map could be calculated, along with the microvascular density for the small vessel map, for all mice in each age group. No significant difference was found between the age groups for either of these metrics. (D) Representative histograms of the blood velocities across the entire coronel hemisphere from an example young and aged mouse, demonstrating a shift in the distribution shape. Across all mice in this study, we found a significantly increased right skewness (1.16 vs. 0.98, p = 0.002) in the distribution of blood velocities of the whole brain in the aged cohort versus the young cohort. ULM images were rendered using MATLAB (R2019a, https://www.mathworks.com/).

