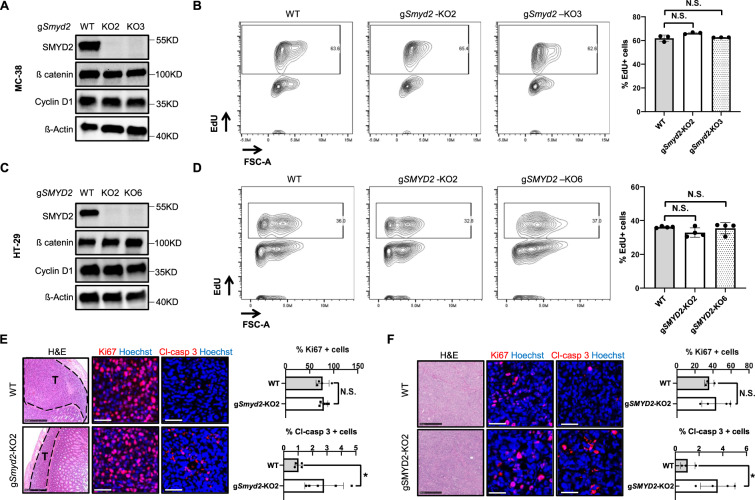
Fig. 2. Proliferation is not impeded in SMYD2 deficient CRC cells.
Immunoblot analysis of SMYD2, Cyclin D1, and ß catenin in lysates of WT and two clones of CRISPR/Cas9-directed SMYD2 knockout MC-38 cells (A) or HT-29 cells (C). β-Actin served as a loading control. Flow cytometry assay of EdU in WT and SMYD2 CRISPR/Cas9 knockout MC-38 cells (B) or HT-29 cells (D). Graph shows quantification of EdU-positive cells. Experiments were performed three times and representative data are shown. Data are presented as mean+SD and student’s t-test was used for statistical calculation. N.S., not significant. Representative images of H&E, Ki67 (red), and cleaved-caspase 3 (red) stained MC-38 tumor tissues (E) or HT-29 tumor tissues (F). Scale bar, 50 µm. Histograms in E and F show quantification of Ki67 or cleaved-caspase 3 positive cells in tumor tissues. n (MC-38 WT) = 4, n (MC-38 gSmyd2-KO2) = 5, n (HT-29 WT) = 3, n (HT-29 gSMYD2-KO2) = 4.

