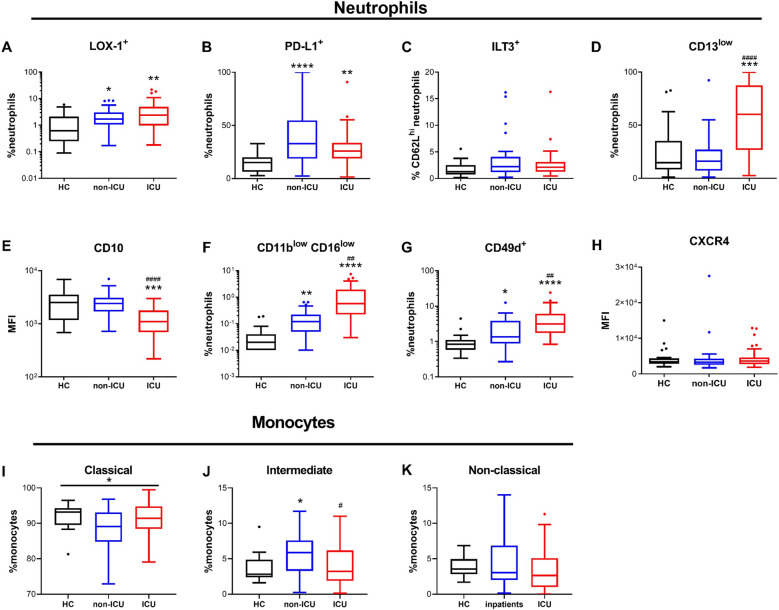
Figure 2.
Neutrophil and monocyte subpopulations are disturbed in COVID-19 patients. (A–H) Percentages of positive cells and surface expression of markers related to subpopulations in neutrophils by flow cytometry. (A) LOX-1 + neutrophils, (B), PD-L1 + neutrophils, (C) ILT3 + CD62L + neutrophils, (D) CD13low neutrophils, (E) CD10 expression on neutrophils, (F) CD11blowCD16low neutrophils, (G) CD49 + neutrophils, (H) HLA-DR expression on neutrophils. (I–K) Percentages of monocytes subpopulations by flow cytometry. (I) CD14 + CD16- classical monocytes, (J) CD14 + CD16 + intermediate monocytes, (K) CD14low/-CD16 + atypical monocytes. Intergroup comparison by Mann–Whitney U test between healthy controls and ICU or non-ICU patients: ****P < 0.0001, ***P < 0.001, **P < 0.01, *P < 0.05, between non-ICU and ICU patients: ####P < 0.0001, ###P < 0.001, ##P < 0.01, #P < .05. All boxplots whiskers represent 10th and 90th percentiles. HC healthy controls.

