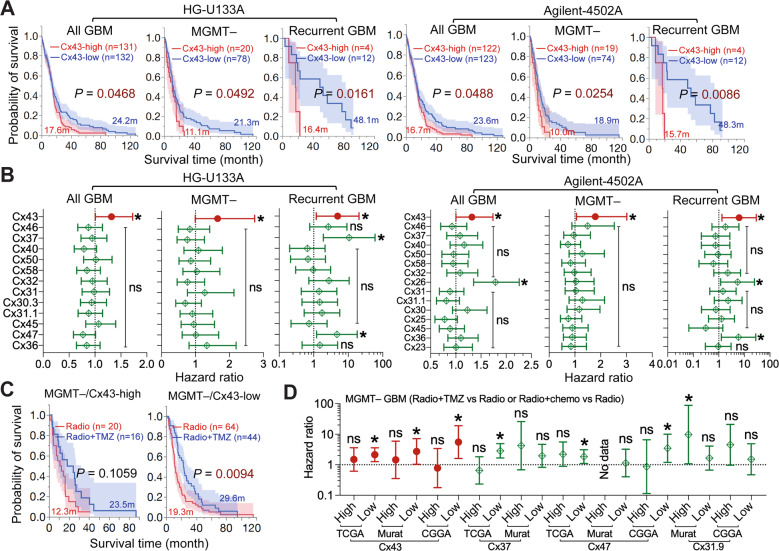
Fig. 2. mRNA levels of Cx43, but not other connexins, correlate with GBM poor prognosis and chemoresistance.
GBM datasets were retrieved from cBioPortal, GlioVis, or CGGA data portal. Immunostaining results of high-grade glioma were obtained from the Human Protein Atlas. A Kaplan–Meier analysis in the TCGA HG-U133A and Agilent-4502A microarray datasets. Patients were divided into Cx43-high (red; top 25 percentile) or Cx43-low (blue; bottom 25 or 75 percentile) based upon Cx43 mRNA levels in all GBM (All GBM), MGMT promoter methylated primary GBM (MGMT–), or recurrent GBM only (Recurrent GBM). Case number (n), mean survival time in months (m), and log-rank P values are shown. Red or blue shadows represent 95% confidence interval of Cx43-high or Cx43-low group, respectively. B Cox univariate analysis in the TCGA HG-U133A and Agilent-4502A microarray datasets. The Cox univariate analysis employs the Cox proportional hazards model to yield a hazard ratio that indicates risk levels of death in patients with high mRNA levels of connexins compared to those with low levels. The resulting P value determines significance of hazard ratio. Cx43 is highlighted in red. C Kaplan–Meier analysis in TCGA HG-U133A. MGMT– GBMs were divided into Cx43-high or Cx43-low group as described above. Patients treated with radiation alone (Radio; red) were compared to patients treated with both radiation and TMZ (Radio+TMZ; blue). D Cox univariate analysis in TCGA HG-U133A, Murat GBM, and CGGA recurrent GBM. MGMT-deficient primary GBMs or recurrent GBMs were divided into Cx43-high or Cx43-low groups. One-Way ANOVA was used to determine statistical significance. *P < 0.05. ****P < 0.0001. ns: not significant. Error bars are standard deviations.

