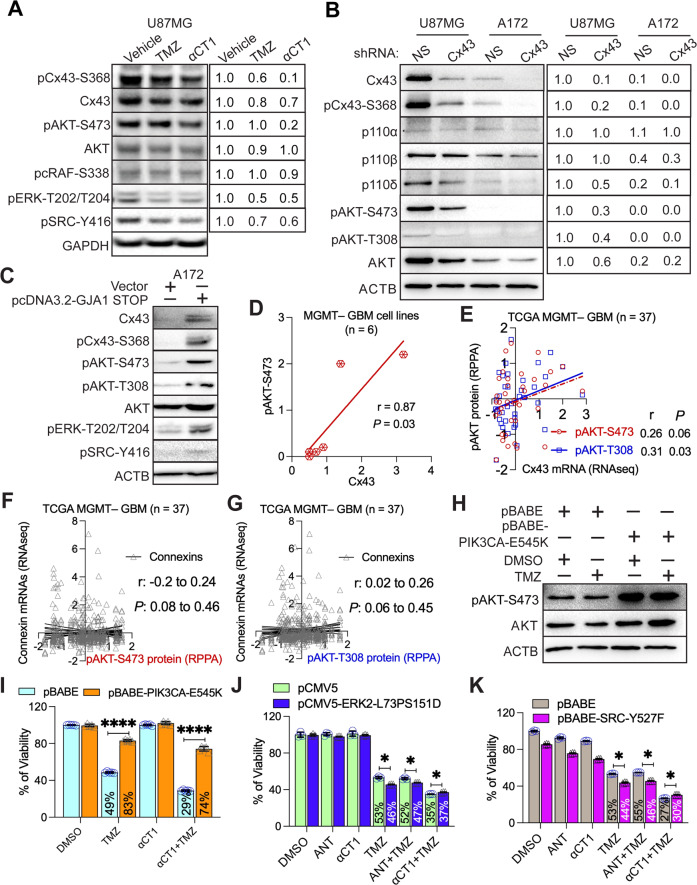
Fig. 3. Cx43 blockade inactivates PI3K.
A Signaling pathways affected by αCT1. Cx43-high U87MG cells were treated with 100 μM αCT1 or 50 μM TMZ for 4 days. pAKT-S473, pcRAF-S338, pERK-T202/T204, and pSRC-Y416 were analyzed using immunoblotting. Glyceraldehyde 3-phosphate dehydrogenase (GAPDH) was the loading control. Band intensities (mean gray value × area) were quantified using Image J. The vehicle DMSO or water was set as 1.0 and each treatment was normalized to the vehicle. B PI3K signaling upon depletion of Cx43. U87MG and Cx43-low A172 cells were treated with a non-silencing short hairpin RNA (NS shRNA) or a Cx43 shRNA. Band intensities were quantified using Image J. U87MG cells treated with NS shRNA were set as 1.0. β-actin (ACTB) was the loading control. C PI3K signaling in Cx43-overexpressing cells. U87MG cells were transfected with either vector or pcDNA3.2-GJA1 STOP. PI3K, ERK, and SRC signaling was analyzed using immunoblotting. Pearson coefficient correlation analysis between protein levels of Cx43 and pAKT-S473 was performed using Prism 9 in 6 MGMT– GBM cell lines (D), mRNA levels of Cx43 and protein levels of pAKT-S473 or pAKT-T308 in MGMT– patients (E), or mRNA levels of connexins and protein levels of pAKT-S473 (F) and pAKT-T308 (G) in MGMT– GBMs. The Pearson correlation coefficient (r) and P value that determines statistical significance of the coefficient are shown. Cell line data were retrieved from our previous studies [21, 27]. H Expression of PIK3CA-E545K (an active PI3K mutant). U87MG cells were transfected with pBABE or pBABE-PIK3CA-E545K encoding PIK3CA-E545K followed by the treatment of 100 μM TMZ. DMSO is the vehicle control. I The effect of PIK3CA-E545K on the αCT1/TMZ-induced growth inhibition. The above-transfected cells were treated with a combination of 100 μM αCT1 and/or 100 μM TMZ for 6 days. Cell viability was measured using the MTS viability assay. Percentages of viability were obtained by normalizing the MTS readings of treatment groups to that of DMSO. J The effect of ERK2-L73PS151D on the αCT1/TMZ-induced growth inhibition. U87MG cells were transfected with pCMV5 or pCMV5-ERK2-L73PS151D (encoding an active ERK2 mutant) followed by the treatment of αCT1 or antennapedia peptide (ANT; the control peptide for αCT1) and/or TMZ. K The effect of SRC-Y527F on the αCT1/TMZ-induced growth inhibition. U87MG cells were transfected with pBABE or pBABE-SRC-Y527F (encoding an active SRC mutant) followed by the treatment of αCT1 or ANT and/or TMZ. RNA sequencing (RNAseq) data and results of reverse phase protein array (RPPA) were retrieved from the TCGA database. Student’s t test was used to determine statistical significance. *P < 0.05; ****P < 0.0001. Three independent experiments were performed to yield standard deviations (error bars).

