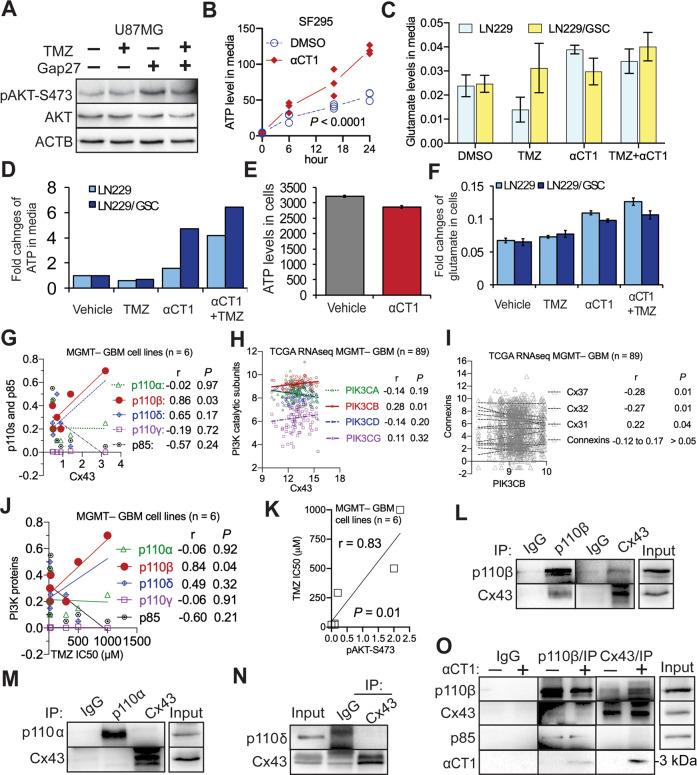
Fig. 4. αCT1 inactivates PI3K independent of Cx43-channels and Cx43 selectively binds to p110β.
A The effect of Gap27 on PI3K signaling. U87MG cells were treated with 100 μM TMZ or 100 μM Gap27. PI3K signaling was assessed by immunoblotting. B ATP release from Cx43-high/MGMT–/TMZ-resistant SF295 cells. Cells were treated with 100 μM αCT1. Culture media were collected at different time points. ATP was measured using a colorimetric assay as described in Methods. One-way ANOVA was used to determine statistical significance. C Glutamate release in Cx43-low/MGMT–/TMZ-sensitive LN229 or Cx43-high/MGMT–/TMZ-resistant LN229/GSC cells. Cells were treated with 100 μM TMZ and/or 100 μM αCT1. Glutamate in culture media was determined using a colorimetric assay. D ATP release in LN229 and LN229/GSC cells. E ATP levels inside of SF295 cells. F Glutamate levels inside of LN229 and LN229/GSC cells. GSC glioblastoma stem cells. Pearson coefficient Correlation between protein levels of Cx43 and PI3K catalytic subunits in 6 MGMT– GBM cell lines (G), mRNA levels of Cx43 and PI3K catalytic subunits in MGMT– GBM patients (H), mRNA levels of PIK3CB and connexins in MGMT– GBM patients (I), protein levels of p110 proteins and IC50s of TMZ in 6 MGMT– GBM cell lines (J), or protein levels of pAKT-S473 and IC50s of TMZ in 6 MGMT– GBM cell lines (K). Cell line data were retrieved from our previous studies [21, 27]. RNAseq data were retrieved from the TCGA database. The Pearson correlation coefficient r and corresponding P are shown. Co-immunoprecipitation of Cx43 and p110β (L), p110α (M), or p110δ (N) was performed in U87MG cells as described in Methods. O Co-immunoprecipitation of Cx43 and p110β in U87MG cell lysates treated with 100 μM αCT1. αCT1 is about 3 kDa and recognized by the Cx43 antibody. IP immunoprecipitation. Rabbit IgG was used as the control. Three independent experiments were performed to yield standard deviations (error bars).

