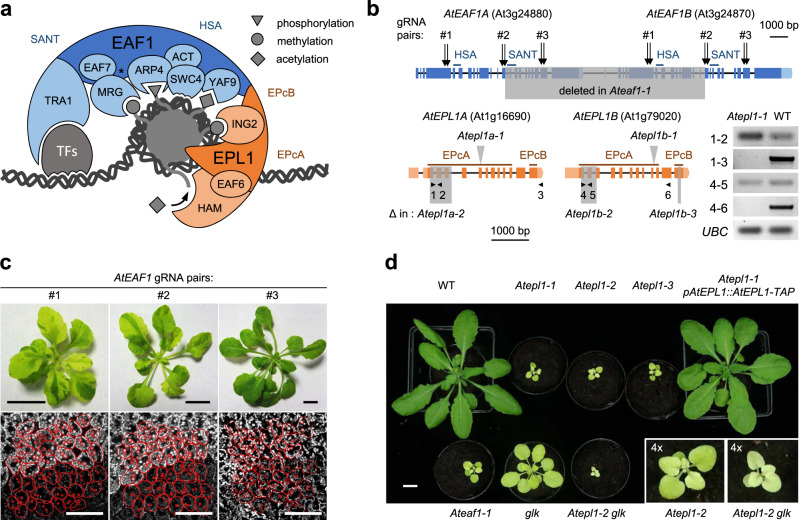
Fig. 1. Ateaf1 and Atepl1 mutants as tools for genetic analysis of the plant NuA4 complex.
a Schematic overview of the NuA4 complex engaging chromatin. The catalytic picNuA4 module and the regulatory module are colored orange and blue, respectively. The asterisk between EAF7 and ARP4 indicates the lack of an EAF5 homolog in plants. The approximate positions of the crucial protein domains are indicated by the labels outside the shapes representing the subunits. b Gene structure diagrams of the AtEAF1 and AtEPL1 loci. The target sites for the three double gRNA constructs (gRNA pairs) used for AtEAF1 mutagenesis are denoted by arrows. The shaded areas delimit Cas9-gRNA-induced deletions (Δ) characterizing particular alleles. The gray arrowheads indicate T-DNA insertion sites. The small black arrowheads indicate the sites of primers used for the RT–PCR analysis presented in the panel on the right. c Transgenic plants carrying the three different Cas9-gRNA constructs. The scale bar represents 10 mm in all images. The lower panels show confocal images of chlorophyll autofluorescence in the palisade mesophyll cell layer of a leaf, centered on the border regions between green (upper part) and pale green (lower part) sectors. The red outlines delimit selected cells and chloroplasts. The scale bar represents 50 μm in all micrographs. d Four-week-old WT and mutant plants grown under the same conditions. The insets show the same images at ×4 magnification. The scale bar represents 10 mm.

