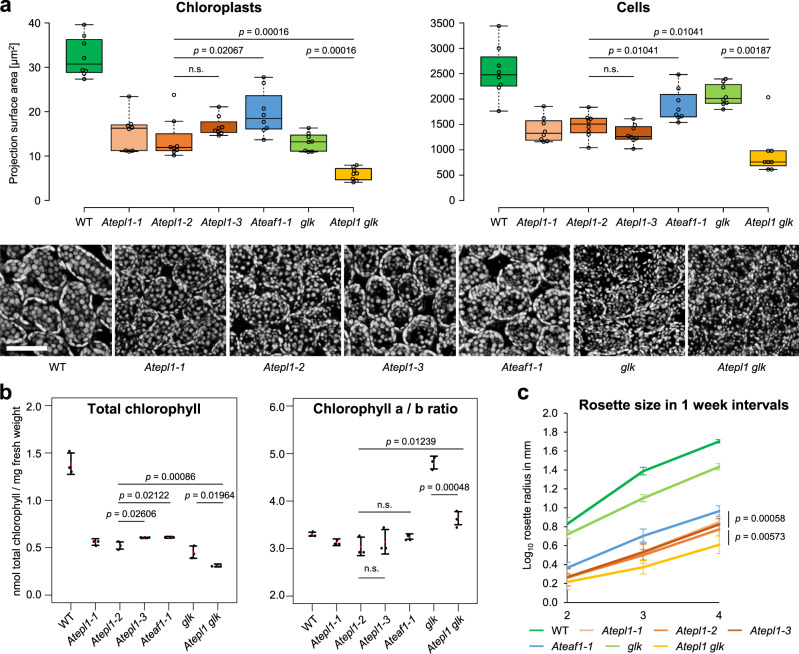
Fig. 2. Growth- and chloroplast development-related phenotypes of the NuA4 mutants are enhanced by glk mutations.
a Quantification of the chloroplast and cell size data acquired by microscopic imaging of the palisade mesophyll cell layer. The center line of a boxplot indicates the median; the upper and lower bounds indicate the 75th and 25th percentiles, respectively; and the whiskers indicate the minimum and maximum. Each circle represents a median surface area of 20 chloroplasts or 9 cells measured in a single biological replicate (a single confocal stack from a separate plant). Statistical significance was determined by a two-tailed Mann–Whitney U test. The chlorophyll autofluorescence images below the plots are projections of example stacks used for the measurements. All of the images are on the same scale. The scale bar represents 50 μm. b Determination of the total chlorophyll content and the chlorophyll a/b ratio by spectroscopic analysis of extracted chlorophyll. The dots indicate biologically independent replicates (three per each genotype), while the red dots indicate means. The whiskers delimit 95% confidence intervals. Statistical significance was determined by a two-tailed t test. c Growth quantification of the mutants. The nodes indicate the mean rosette radius of 10 or 20 (Atepl1-2) plants grown in parallel. The whiskers delimit 95% confidence intervals. p values are given for the Ateaf1-1 vs. Atepl1-2 (upper) and Atepl1-2 vs. Atepl1 glk (lower) comparisons. Statistical significance was determined by a two-tailed t test. Source data are provided as a Source Data file.

