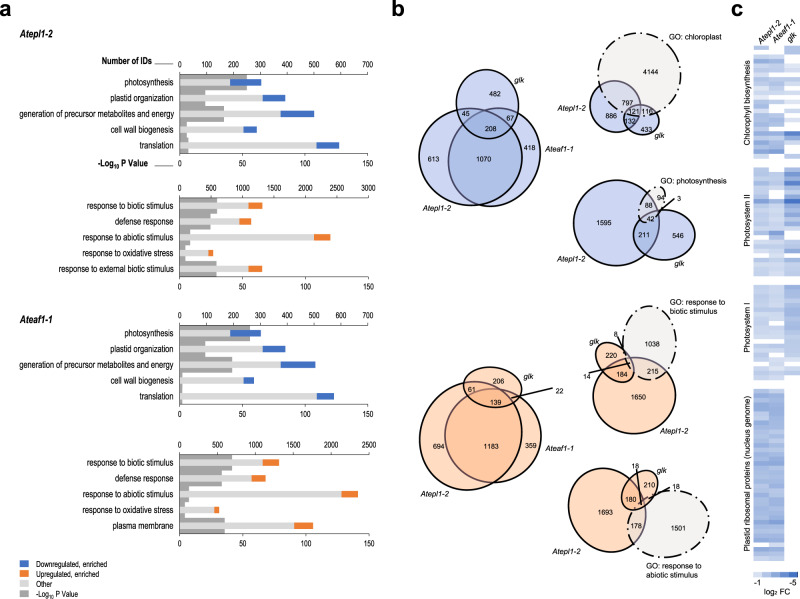
Fig. 3. NuA4 influences the expression of chloroplast-related and stress-responsive genes.
a Gene ontology enrichment analysis of the down- and upregulated genes in Atepl1-2 and Ateaf1-1. The five representative GO categories displayed in each graph were selected manually from the lists presented in Supplementary Data 8 and 11. Gene enrichment analyses were performed using the PANTHER overrepresentation test. b Area-proportional Venn diagrams illustrating the overlap between genes exhibiting an expression change in the same direction in the Atepl1-2, Ateaf1-1 and glk1 mutants as well as the gene sets representing particular GO categories. All numeric values indicate the numbers of genes present in a single sector of the diagram rather than the total values for the sets. c Relative transcript levels (log2 FC) of the genes encoding four selected groups of chloroplast proteins in Atepl1-2, Ateaf1-1, and glk. Empty fields indicate a lack of significant change. Source data are provided as a Source Data file.

