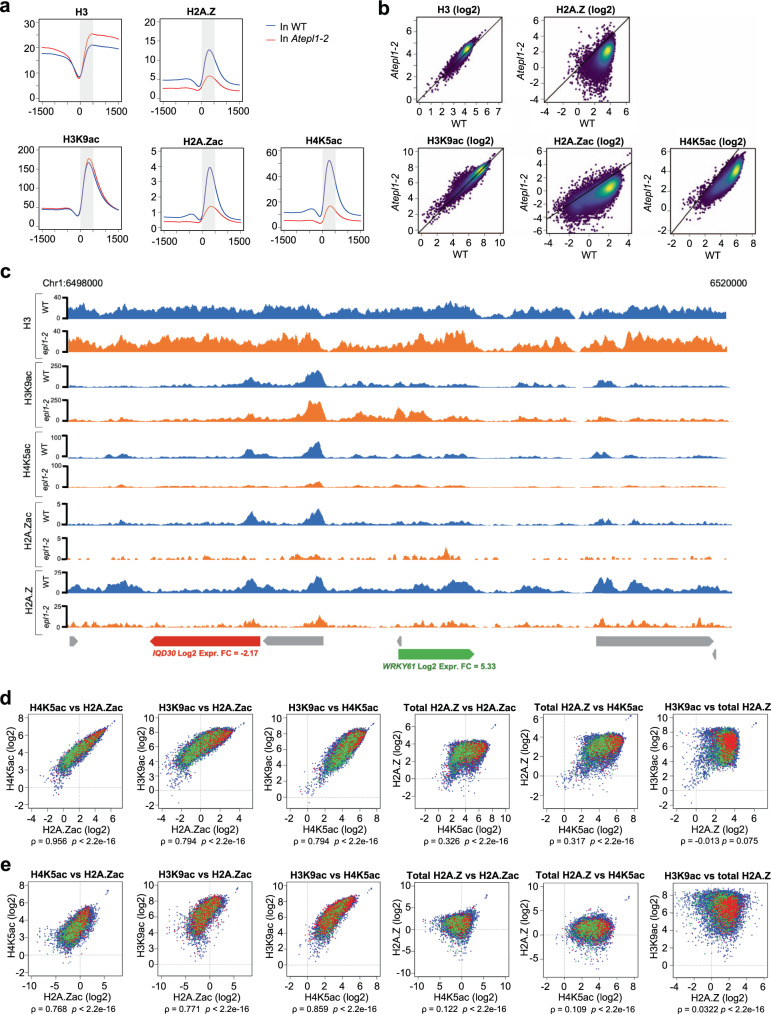
Fig. 5. NuA4 acetylates H4 and H2A.Z and stimulates H2A.Z deposition on chromatin.
a TSS-centered profiles of spike-in-normalized occupancy of H3, H2A.Z, H3K9ac, H4K5ac and H2A.Zac averaged over all genes expressed in WT Col-0 (n = 18,620). The values on the vertical axes are relative. The values on the horizontal axes indicate the chromosomal position relative to the TSS (i.e., negative values represent the promoter region, whereas positive values represent the gene body). To profile H2A.Zac we used an antibody raised against human H2A.Zac, which also specifically recognizes Arabidopsis H2A.Zac (Crevillén et al.17; Supplementary Fig. 8c). b Scatter plots showing differences in the H3, H2A.Z, H3K9ac, H4K5ac and H2A.Zac occupancy between Atepl1-2 and WT. Each dot represents the log2-transformed ChIP-seq signal averaged over the first 500 bp downstream of the TSS (shaded in a) of a single gene in WT and Atepl1-2. The number of dots per pixel is color-coded. c A fragment of chromosome 1 showing spike-in-normalized H3, H2A.Z, H3K9ac, H4K5ac, or H2A.Zac occupancy across several loci. The particular chromosomal locations were chosen to illustrate changes in the chromatin environment coinciding with increased (green) or decreased (red) transcript levels vs. transcript levels with no significant change (gray). The values on the vertical axes are relative. d Scatter plots showing interrelationships between H2A.Zac, H4K5ac, H3K9ac and total H2A.Z occupancy in WT. Each dot represents the log2-transformed ChIP-seq signal averaged over the first 500 bp downstream of the TSS (shaded in a) of a single gene. The color of dots indicates gene transcriptional response in Atepl1-2 (upregulation, green, downregulation, red, no change, blue). Spearman rank correlation values are shown below the plots. e As in d, but for Atepl1-2.

