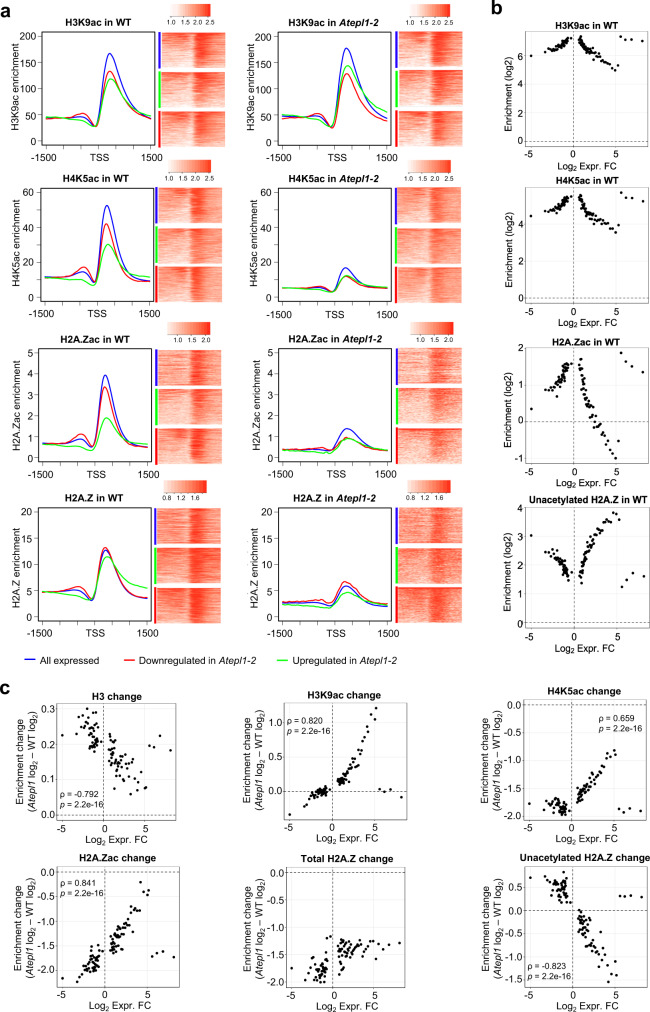
Fig. 6. Gain of H3ac and loss of H4ac and H2A.Zac shape the Atepl1-2 transcriptome.
a Spike-in-normalized H3K9ac, H4K5ac, H2A.Zac, and total H2A.Z profiles at the TSS for all genes expressed in the WT (n = 18,620; blue) as well as for genes downregulated (n = 941; red) and upregulated (n = 1746; green) in Atepl1-2. For each pair of plots, the plot on the left shows the acetylation profiles as detected in the WT, while the plot on the right shows the modifications in the Atepl1-2 mutant. The values on the vertical axes are relative. The values on the horizontal axes indicate the chromosomal position relative to the TSS. The heatmaps show the corresponding three groups of genes ordered according to the average enrichment level on a logarithmic scale. For the all expressed genes category, 2500 randomly selected genes are shown. b Scatter plots showing correlations between chromatin marks (H3K9ac, H4K5ac, H2A.Zac, and unacetylated H2A.Z occupancy in WT) and gene expression change (log2 fold change) as calculated by percentiles of expression change. Genes dysregulated in Atepl1-2 (n = 5135) were sorted based on their fold change and divided into percentiles. For each percentile, the mean change in expression and the mean log2-transformed spike-in normalized ChIP-seq signal were calculated and plotted. To estimate values for non-acetylated H2A.Z, the ChIP-seq signal for acetylated H2A.Z were subtracted from the signal obtained for total H2A.Z. c Scatter plots showing correlations between changes in chromatin marks (H3, H3K9ac, H4K5ac, H2A.Zac, total H2A.Z, and unacetylated H2A.Z occupancy) and gene expression change (log2 fold change) as calculated by percentiles of expression change. Genes dysregulated in Atepl1-2 (n = 5135) were divided into percentiles as in b. For each percentile, the mean change in expression and the mean difference in the level of the log2-transformed spike-in normalized ChIP-seq signal between WT and Atepl1-2 were calculated and plotted. To estimate values for non-acetylated H2A.Z, the differences for acetylated H2A.Z were subtracted from the differences obtained for total H2A.Z. Spearman rank correlation values are shown below the plots.

