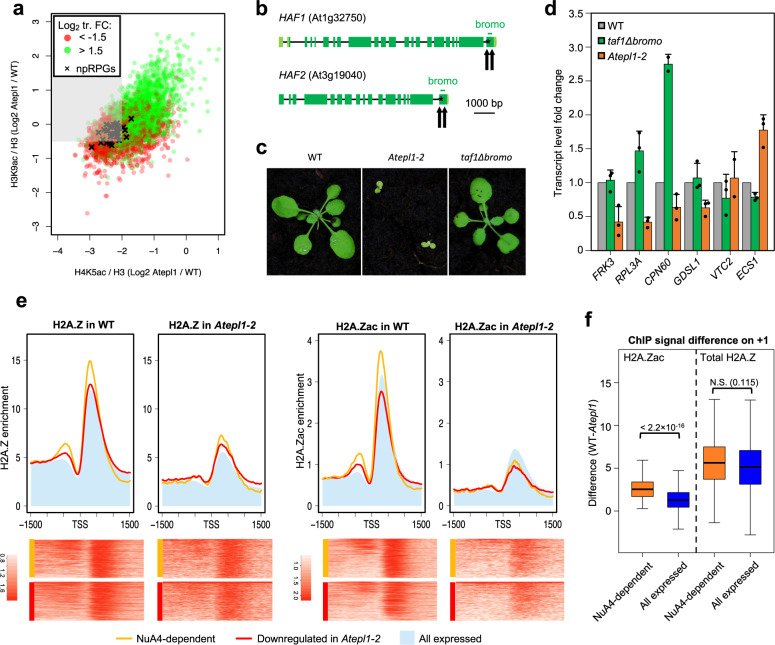
Fig. 7. H2A.Z enrichment on +1 nucleosomes and not TAF1 bromodomain-mediated TFIID recruitment determines the NuA4 dependence of npRPGs.
a Scatter plot showing the relationships between the log2-transformed fold changes in the spike-in- and H3-normalized H3K9ac and H4K5ac occupancies and the directionality of the transcript level change. Genes downregulated in Atepl1 shown within the gray area fulfill all criteria for NuA4 dependency. b Gene structures of the two Arabidopsis thaliana genes encoding the TAF1 subunit of TFIID. The black arrows indicate the Cas9-gRNA cut sites, and the black asterisks mark the positions of premature stop codons in the resulting mutant alleles. c Phenotypes of taf1Δbromo, epl1-1 and WT plants. d RT-qPCR analysis of the relative transcript abundance in the double bromodomain mutant (taf1Δbromo) and the double Atepl1a-1 Atepl1b-1 mutant (Atepl1-1). The genes were selected on the basis of their distinct transcriptional behavior in the haf2-1 mutant (as reported in Bertrand et al.37) and in the Atepl1-1 mutant, as shown in this work by RNA-seq. Average expression levels from three independent replicates ±standard deviations are shown. e Spike-in-normalized H2A.Zac and H2A.Z profiles at the TSS for NuA4-dependent genes (n = 347; orange) as compared to genes downregulated in Atepl1-2 (n = 941; red) and all genes expressed in the WT (n = 18,620; blue shading). The values on the vertical axes are relative. The values on the horizontal axes indicate the chromosomal position relative to the TSS. The heatmaps show the corresponding NuA4-dependent and Downregulated in Atepl1-2 groups of genes ordered according to the average enrichment level on a logarithmic scale. f Boxplots showing the difference between the average H2A.Zac and H2A.Z enrichment in the first 500 bp downstream of the TSS for NuA4-dependent genes (n = 347; orange) and all genes expressed in the WT (n = 18,620; blue). The center line indicates the median; upper and lower bounds indicate the 75th and 25th percentiles, respectively; and the whiskers indicate the minimum and maximum. An unpaired two-sample Wilcoxon test was used to determine significance. Source data are provided as a Source Data file.

