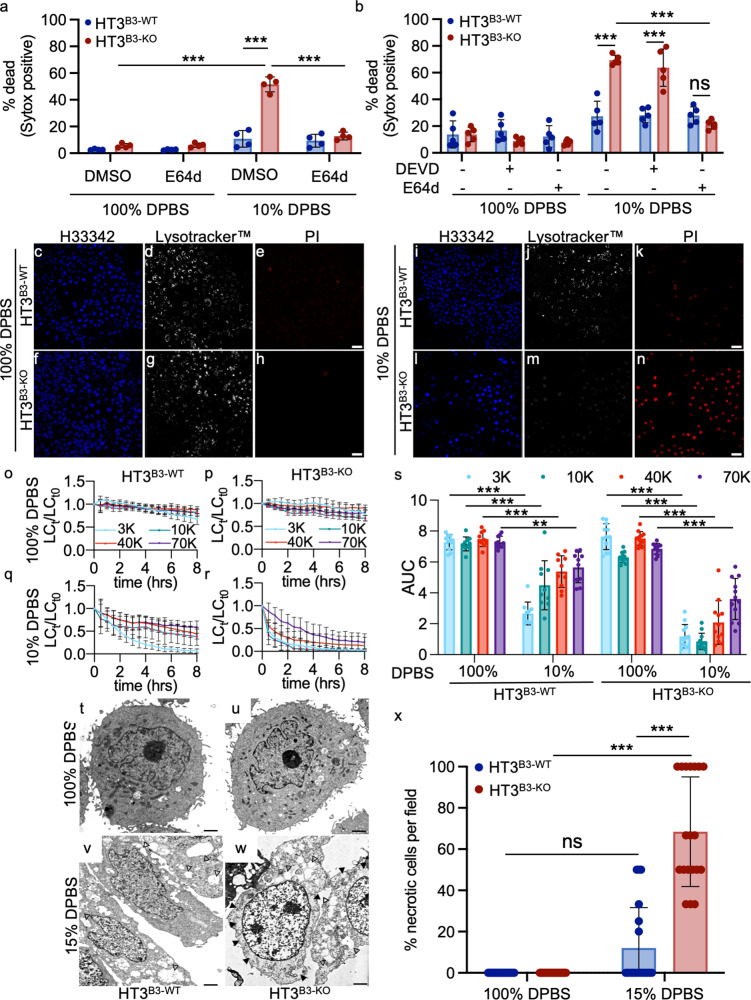
Fig. 4. Hypotonic stress induces lysoptosis-like death in human tumor cell lines null for SERPINB3.
a, b HT3B3-WT (blue) or HT3B3-KO (red) cells were incubated with DMSO, 2 µm E64d (a, b), or 10 µm DEVD-CHO (DEVD; b) for 1 h prior to exposure to 100% or 10% DPBS for 4 h, and stained with SG and H33342. Percent dead was calculated as (# Sytox positive nuclei/# of blue nuclei) × 100. c–n Representative confocal images (scale bar = 25 µm) of HT3B3-WT or HT3B3-KO cell lines treated with 100% DPBS or 10% DPBS for 4 h and then stained with H33342 (blue; c, f, i, l), Lysotracker™ deep red (white; d, g, j, m), and PI (red; e, h, k, n). o–r To quantify LMP, HT3B3-WT (o, q), or HT3B3-KO (p, r) cells were incubated with 3 kDa Cascade blue, 10 kDa Alexa488, 40 kDa TMR, and 70 kDa Texas red conjugated dextrans prior to exposure to 100 or 10% DPBS and imaged using live-cell resonance scanning confocal microscopy (≥10 fields, ≥20 z-planes). The number of lysosomes at each time point (LCt) were normalized to the initial lysosome count at time zero (LCt0). s Area under the curve (AUC) for each dextran over time for both HT3B3-WT (left) or HT3B3-KO (right) cells treated with 100 or 10% PBS. Statistical significance was determined using a two-way ANOVA with Tukey’s multiple comparisons test. t–w Representative TEM images (scale bars = 500 nm) of HT3B3-WT or HT3B3-KO cells treated with 100 or 15% DPBS for 4 h. Vacuolization (closed arrowheads) was noted in the HT3B3-KO, and to a lesser extent in the HT3B3-WT cells, treated with 15% DPBS. x Blinded scoring of the percentage of necrotic appearing cells in 2000x magnification TEM images (≥20 fields) of HT3B3-WT or HT3B3-KO cells treated with 100 or 15% DPBS for 4 h. Unless otherwise noted, a representative of ≥3 replicates is shown, and the means ± SD were compared using a two-way ANOVA with Tukeys’ multiple comparisons (ns not significant, ***P < 0.001, **P < 0.01). Original data files can be found at https://data.mendeley.com/datasets/gnwb39t76k/1.

