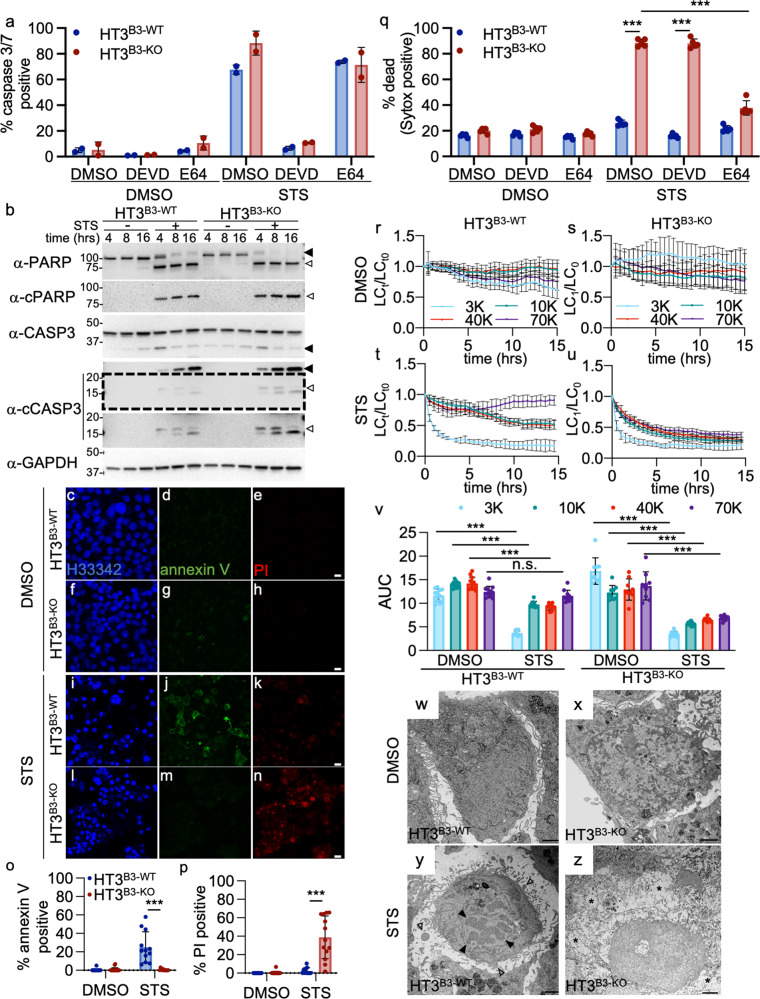
Fig. 6. Tumor epithelial cell lines null for SERPINB3 undergo lysoptosis-like death when exposed to the apoptosis inducer, staurosporine.
a HT3B3-WT or HT3B3-KO cells were pretreated with DMSO, 10 µm DEVD-CHO (DEVD), or E64 for 1 h prior to treatment with DMSO or 10 µm staurosporine (STS) in the presence of NucView caspase-3/7 activity detection reagent for 16 h (% caspase-3/7 positive = (#Nucview positive/# of nuclei) × 100), (Note, this caspase data was performed in conjunction with the Sytox staining shown in q). b Immunoblot analysis of PARP, cleaved PARP (cPARP), caspase-3 cleavage, and actin (α-act) in HT3B3-WT or HT3B3-KO cell lines treated with DMSO (-) or 10 µm STS (+). The dashed area is shown with contrast enhancement below (black arrowheads = full length, open arrowheads = cleavage product). c–n Representative confocal images (scale bar = 25 µm) of HT3B3-WT or HT3B3-KO cells treated with DMSO or 10 µm STS for 18 h and then stained with H33342 (blue), annexin V (green), and PI (red). o, p Quantification of the percent annexin V and PI-positive cells from n ≥ 10 fields shown in (c–n). q HT3B3-WT or HT3B3-KO cells were treated as in (a) and incubated with Sytox™ orange for 16 h (percent dead = (# of Sytox™ positive/# of nuclei) × 100). r–u To quantify lysosomal content, HT3B3-WT or HT3B3-KO cells were incubated with fluorescently labeled different molecular weight dextrans as above, prior to exposure to DMSO or 10 µm STS. Live-cell confocal microscopy was used to determine the number of lysosomes at each time point (LCt) normalized to the initial lysosome count at time zero (LCt0) over n ≥ 9 fields. v AUC for each dextran over time for the experiment in r–u (means compared using two-way ANOVA with Tukey’s multiple comparisons test). w–z Representative TEM images (scale bars = 500 nm) of HT3B3-WT or HT3B3-KO cells treated with DMSO or 10 µm STS for 16 h. Apoptotic morphology indicated with open (membrane budding) and closed arrows (chromatin fragmentation), and necrotic morphology (vacuolization, cytoplasmic clearing) by an asterisk. Unless otherwise noted, a representative of ≥3 replicates is shown, and the means ± SD were compared using a two-tailed t-test (ns not significant, ***P < 0.001). Original imaging data files can be found at https://data.mendeley.com/datasets/6g2typdf63/1. Uncropped immunoblots can be found in Supplementary Fig. 21.

