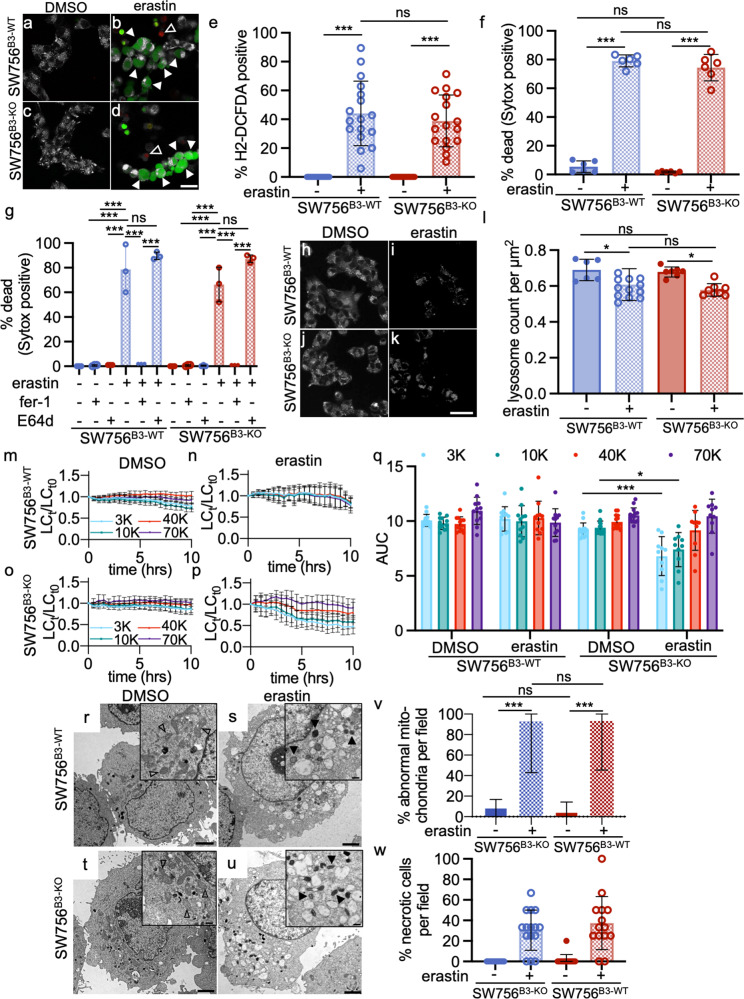
Fig. 8. Erastin induces ferroptosis, but minimal LMP, in SW756B3-WT and SW756B3-KO cells.
a–d Representative confocal images (scale bar = 25 µm) of SW756B3 WT or SW756B3 KO cells treated with DMSO or 20 µm erastin for 12 h in the presence of Sytox™ Orange (red, open arrowheads), then stained with the ROS indicator, H2-DCFDA (green, white arrowheads) and Mitotracker™ Deep Red (white). e Quantification of the percentage of H2-DCFDA positive cells in SW756B3 WT or SW756B3 KO cells after treatment with DMSO (−) or 20 µm erastin (+) for 12 h (means were compared using a one-way ANOVA with Tukey’s multiple comparisons). f The percent dead 12 h after treatment with erastin ((# Sytox positive nuclei/# blue nuclei) × 100, means compared using a one-way ANOVA with Tukey’s multiple comparisons). g SW756B3 WT or SW756B3 KO cells were incubated for 1 h with DMSO (−), ferrostatin-1 (fer-1), or E64d, prior to addition of DMSO (−) or 20 µm erastin (+) for 12 h (% dead and statistical comparison calculated as in panel f). h–k Representative confocal images (scale bar = 25 µm) of SW756B3 WT or SW756B3 KO cells treated with DMSO or 20 µm erastin for 12 h and stained with Lysotracker™ Red. l Quantification of the lysosomal count per cellular µm2 (≥6 fields). m–p SW756B3 WT or SW756B3 KO cells were incubated with fluorescently labeled different molecular weight dextrans as above prior to exposure to either DMSO or 20 µm erastin and imaged using live-cell confocal microscopy. The number of lysosomes were quantified as above. q Area under the curve (AUC) for each dextran over time. (two-way ANOVA with Tukey’s multiple comparisons test). r–u Representative TEM images (scale bars = 2 µm) of SW756B3 WT or SW756B3 KO cells treated with either DMSO or erastin for 12 h. Insets show normal and abnormally appearing mitochondria (open and black arrowheads, respectively; scale bars = 500 nm). v, w Quantification of the number of abnormal mitochondria (v) and necrotic cells (w) in the experiment in panels r–u (≥10 fields). The means ± SD were compared using a two-tailed t-test (ns not significant, ***P < 0.001, **P < 0.01, *P < 0.05). Original data can be found at https://data.mendeley.com/datasets/9m9f4cfhxy/1.

