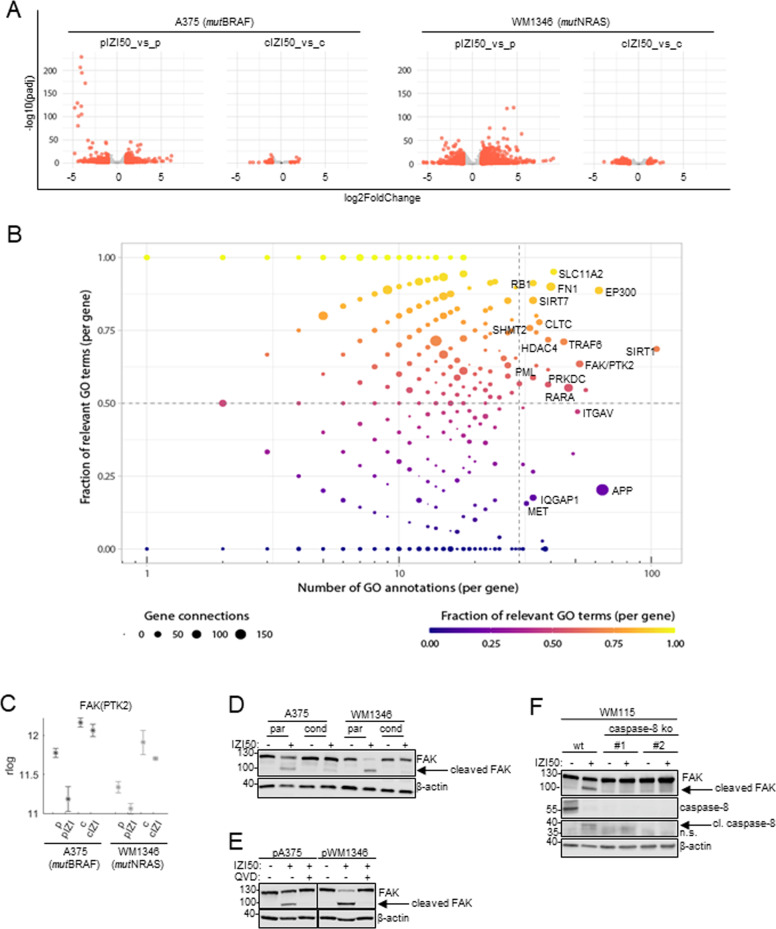
Fig. 4. Transcriptomic analysis identifies FAK as key regulator of the metastatic phenotype of IZI5-conditioned MM cells.
A Parental (p) and conditioned (c) A375 and WM1346 cells remained untreated or where stimulated with IZI50 for six hrs. Subsequently, RNAseq analysis of three biological replicates was performed and gene expression changes presented by vulcano plots. Genes are represented as dots in −log10 (adjusted p-value) versus log2 (fold-change). Differentially expressed genes with adjusted p-value ≤ 0.1 and abs (fold-change) ≥ 1 are marked in red. B Differentially expressed genes with consistent directionality of change in the parental contexts of both cell lines, but not being differentially expressed in the conditioned contexts (1248 genes), were fed into GeneWalk with default settings. Regulators are represented as dots in ‘Fraction of Relevant GO Terms per Gene’ versus ‘Number of GO Annotations per Gene’. C Mean expression (rlog counts) of the FAK(PKT2) gene in parental (p) and IZI5-conditioned (c) A375 and WM1346 cells in response to IZI50 treatment for 6 h. D Parental (p) and IZI5-conditioned (c) A375 and WM1346 cells were stimulated with IZI50. After 24 h processing of FAK was determined by Western-blot analysis. One representative out of three independently performed experiments is shown. E Parental (p) A375 and WM1346 cells were pretreated or not with 5 µM QVD for 1 h. Subsequently cells were stimulated with IZI50 and cleavage of FAK monitored 24 h later by Western-blot analysis. One representative out of three independently performed experiments is shown. F Wildtype (wt) and caspase-8 knock out (clones #1 and #2) WM115 melanoma cells were stimulated with IZI50 and the protein/cleavage status of FAK and caspase-8 assessed after 24 h by Western-blot analysis. β-actin served as loading controls. One representative out of three independently performed experiments is shown.

