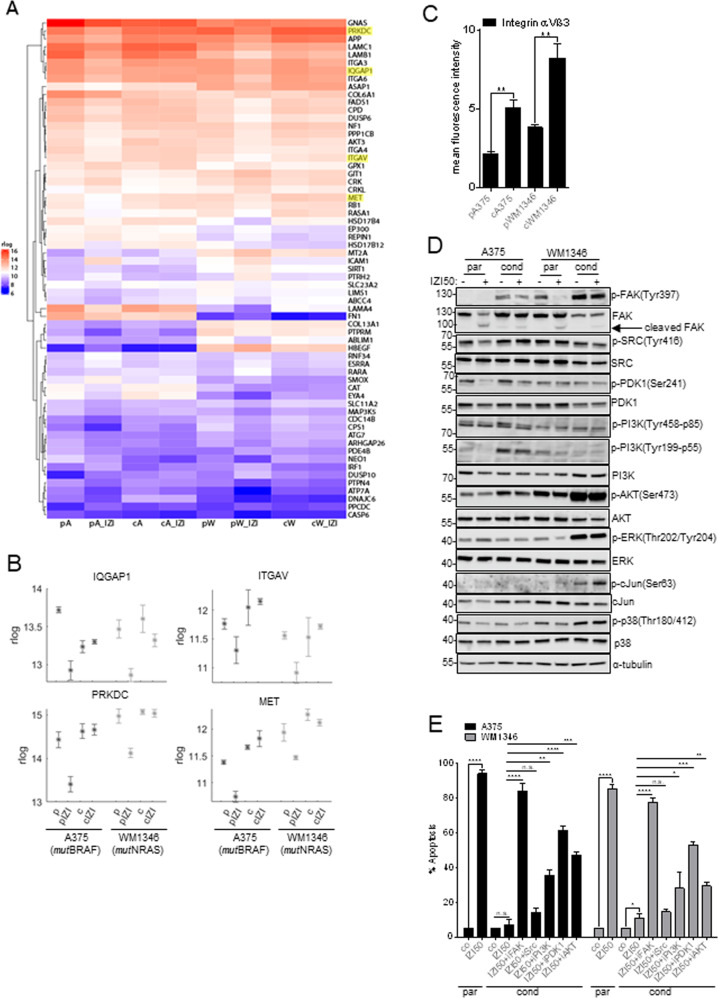
Fig. 5. Integrin-mediated FAK activation causes upregulation of MAPK signaling pathways.
A Mean expression (rlog counts) of the FAK/PTK2 interaction partners in the GeneWalk regulatory network in the different contexts of A375 and WM1346 cells. p=parental; c=conditioned; IZI = stimulated with 50 ng/ml IZI1551; A = A375; W = WM1346. FAK interaction partners that also represented within the 18 top regulators are marked in yellow. B Mean expression (rlog counts) of PRKDC, IQGAP, ITGAV, MET genes in parental (p) and IZI5-conditioned (c) A375 and WM1346 cells in response to IZI50 treatment for 6 h. C The surface expression of integrin αVβ3 on unstimulated parental (p) and IZI5-conditioned (c) A375 and WM1346 cells was determined by flow cytometry (n = 3: **p ≤ 0.01). D Parental (p) and IZI5-conditioned (c) A375 and WM1346 cells were stimulated with IZI50. After 24 h the phosphorylation status of FAK, SRC, PDK1, PI3K, AKT, ERK, cJUN, and p38 was monitored by Western-blot analysis with α-tubulin as loading control. One representative out of three independently performed experiments is shown. E Parental (p) A375 and WM1346 cells were stimulated with IZI50. IZI-conditioned (c) cells were treated for 1 h with the FAK inhibitor (iFAK; 5 µM) defactinib, the SRC inhibitor (iSrc; 10 µM) dasatinib, the PI3K inhibitor (iPI3K; 20 µM) alpelisib, the PDK1 inhibitor (iPDK1; 10 µM) GSK2334470, and the AKT inhibitor (iAKT; 20 µM) afuresertib, respectively, prior to IZI50 stimulation. After 24 h apoptosis induction was assessed using a CDDE (n = 3: *p ≤ 0.05; **p ≤ 0.01; ***p ≤ 0.001; ****p ≤ 0.0001; n.s. = not significant).

