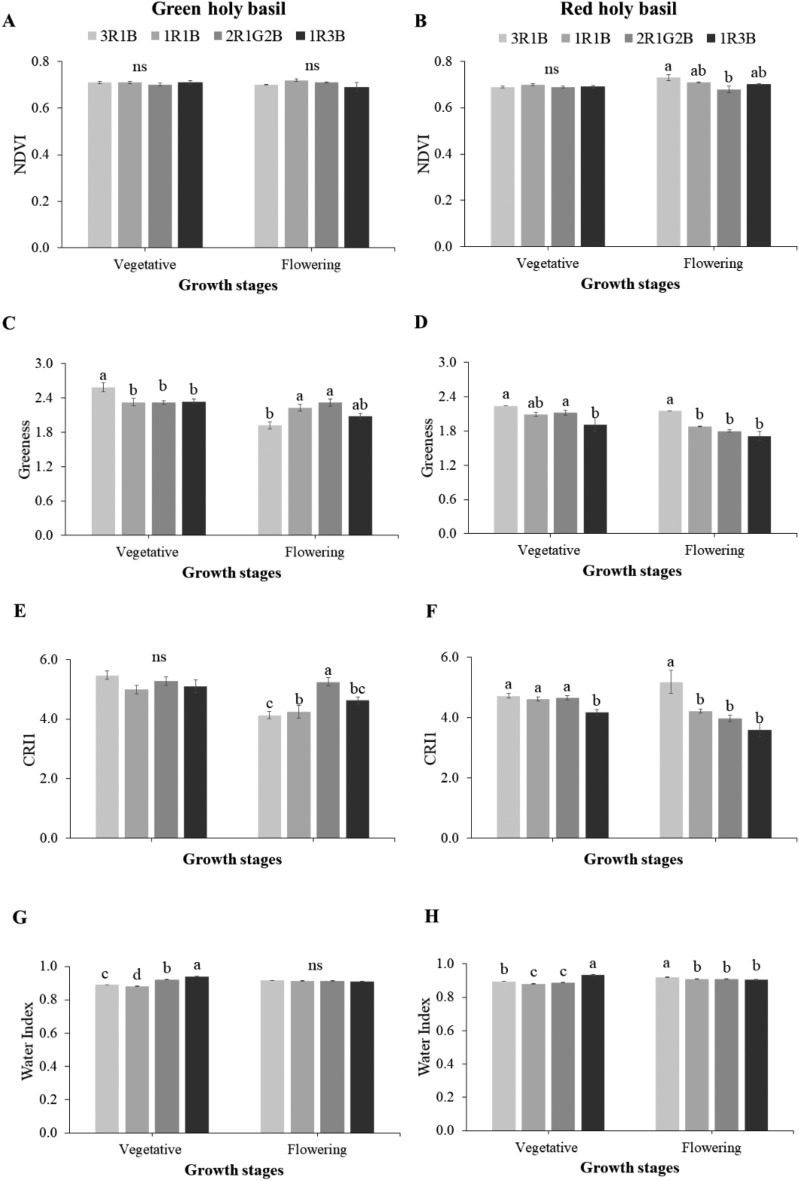
Figure 5.
Reflectance spectral indices, normalized difference vegetation index (NDVI), greenness index (G), carotenoid reflectance indexes (CRI2) and water index (WI) of green and red holy basil at vegetative and flowering stages under four different light treatments (3R:1B, 1R:1B, 2R:1G:2B, and 1R:3B). R, G and B represent the red, green and blue llight spectra, respectively, and number before the letters stand for the ratio of each lighrt spectra. Values are represented as mean ± SE (n = 4). ANOVA was performed followed by mean comparison with DMRT. Lower-case letters above bars indicate significant difference (p < 0.05); “ns” indicates no significant difference. Bars indicate standard errors.

