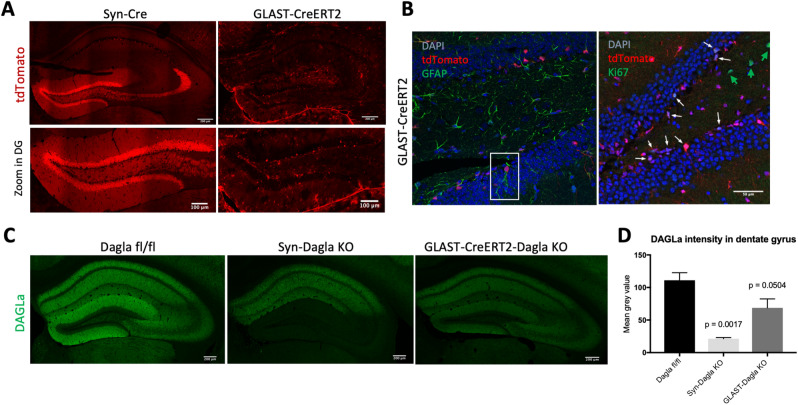
Figure 2.
Syn-Dagla KO and GLAST-CreERT2-Dagla KO lines show opposing patterns of DAGLa deletion in the hippocampal dentate gyrus (DG). (A) Validation of Cre-efficacy in hippocampus (top, scale bar 200 µm) and DG (bottom, scale bar: 100 µm) in Syn-Cre and tamoxifen-induced GLAST-CreERT2 lines crossed with the RosaTomato reporter line. GLAST-CreERT2 show tdTomato expression (red) and thus recombination activity in areas populated mostly by glial cells, especially in the subgranular zone (SGZ) of DG, but not in neurons in the granule cell layer of DG. Syn-Cre mice show tdTomato expression specifically in neurons in the granule cell layer of DG and CA3 but not in CA1 and CA2 or SGZ. (B) (Left) Co-staining of GLAST-CreERT2-RosaTomato with glial marker GFAP (green) in dentate gyrus. TdTomato expressing glia cells are mainly localized in the subgranular zone (SGZ) of dentate gyrus and show typical shape of neural stem and progenitor cells (NSPCs, example in white box)). Only few astrocytes not located in SGZ show tdTomato expression. (Right) Co-staining of GLAST-CreERT2-RosaTomato with proliferation marker Ki67 (green). 68% of all proliferating cells express Cre; 17% of all Cre-expressing cells are proliferating cells (n = 3 animals/group; white arrows: cells co-expressing tdTomato and Ki67; green arrow: proliferating cells not expressing tdTomato). (C) Representative images of DAGLa immunostainings from hippocampi. In Dagla fl/fl control mice, DAGLa is highly expressed throughout the hippocampus. Syn-Dagla KO mice show a very low DAGLa signal in dentate gyrus (DG) and cornu ammonis 3 (CA3), while CA1 and CA2 show similar DAGLa expression as in Dagla fl/fl control mice. The DAGLa signal in hippocampus of GLAST-CreERT2-Dagla KO mice is markedly reduced compared to control mice. (D) Quantification of DAGLa signal intensity in the DG of conditional knockout mice. GLAST-CreERT2-Dagla KO mice show a significant reduction of DAGLa signal in the dentate gyrus, that was even more pronounced in Syn-Dagla KO mice (1-way ANOVA: F2,6 = 18.34; p = 0.0028; n = 3 per group).

