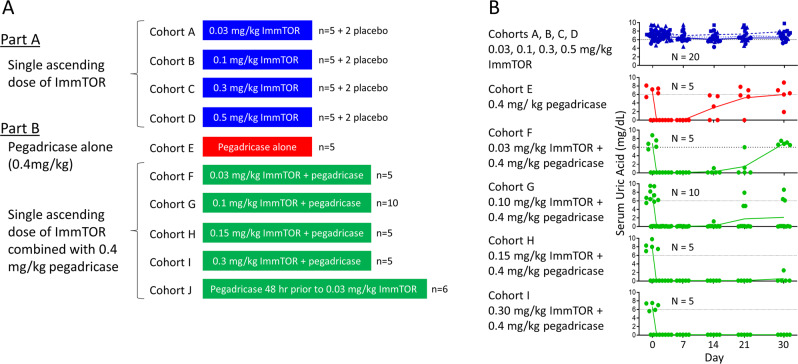
Fig. 3. Single ascending dose study of ImmTOR and SEL-212 in patients with hyperuricemia.
A Schematic of cohorts dosed with pegadricase alone (Cohort A), single escalating doses of ImmTOR alone (Cohorts B–E), or single escalating doses of SEL-212 (Cohorts F–J, 0.03, 0.1, 0.15, or 0.3 mg/kg ImmTOR combined with a fixed dose of 0.4 mg/kg pegadricase). Cohorts B–E were double blinded and randomized to either placebo or study drug in a 2:5 rato, while Cohorts A and F–J were open-label. All cohorts consisted of 5 drug-treated patients, except for Cohort G, that contained 10 patients and Cohort J which contained 6 patients. In addition, Cohorts B–F each contained two patients that received placebo (vehicle). Patients in Cohorts F–I received an IV infusion of ImmTOR followed immediately by an IV infusion of pegadricase. Patients in Cohort J received an IV infusion of pegadricase followed 48 h later by an IV infusion of ImmTOR. B Serum uric acid levels over time. Each symbol represents sUA levels for an individual patient at various timepoints indicated and the lines indicate mean sUA levels for the cohort. The dotted black line represents 6 mg/dL sUA. Source data are provided as a Source Data file.

