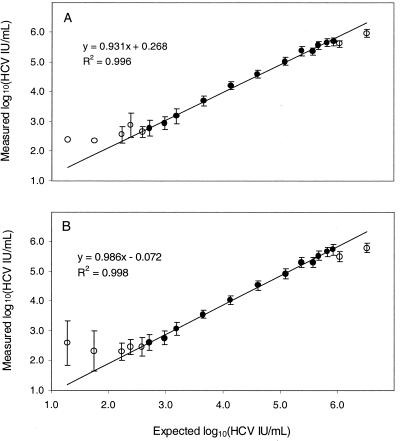
FIG. 1.
Linear range for the COBAS AMPLICOR (A) and AMPLICOR HCV MONITOR (B) v2.0 tests. Twenty to 48 replicate tests were performed for each input viral RNA concentration. For expected RNA concentrations below 1,600 IU/mL, some of the replicates gave negative results and were excluded from the data analysis. At each expected RNA concentration, the mean of the log10 measured RNA concentrations (circles) and the standard deviations (error bars) were determined. The closed circles, representing measured RNA concentrations between 500 and 500,000 IU/ml, show the results for concentrations used for linear regression analysis. The open circles show results for concentrations that were not included in the regression analysis. The regression analysis was performed using the averaged result for each expected RNA concentration.

