Figure 1.
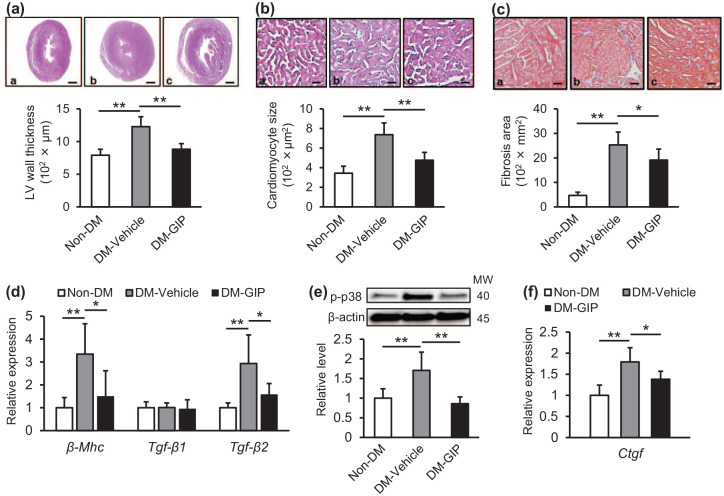
Effects of GIP treatment on the hearts of diabetic db/db mice: Diabetic db/db mice were treated with vehicle (DM-Vehicle) or GIP (DM-GIP) for 6 weeks. Left ventricular wall thickness (a) and cardiomyocyte sizes (b). Upper panels show representative microscopic images of the left ventricle stained with H&E. (c) Interstitial fibrosis. Upper panels show representative microscopic images of the left ventricle stained with Masson’s trichrome. a–c: a, Non-DM; b, DM-Vehicle; c, DM-GIP. Scale bars: a, 1 mm; b, 0.05 mm; c, 0.1 mm. (d) Cardiac gene expression levels of β-Mhc, Tgf-β1, and Tgf-β2. (e) Cardiac protein levels of p-p38. (f) Cardiac gene expression levels of Ctgf. d–f: Gene expression and protein levels of target molecules were normalized by those of internal control 18 s rna and β-actin, respectively.
Data were shown as relative levels to the control mice. n = 6 per group. *p < 0.05, **p < 0.01.

