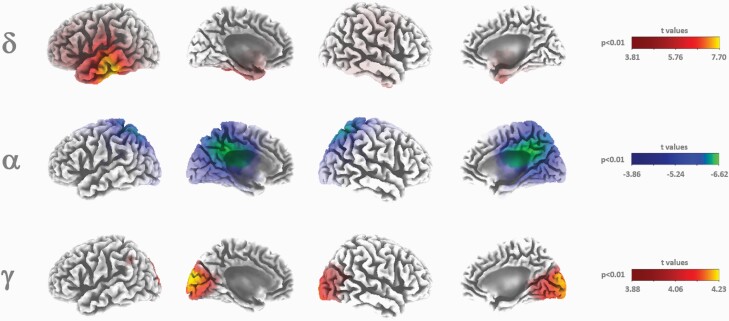
Figure 2.
Three-dimensional LORETA statistical maps from the first 3 minutes after the acute inhalation of salvinorin-A (SA) compared with placebo for the delta (1.3–3.5 Hz), alpha (7.5–13 Hz), and gamma (35–40 Hz) frequency activities. Cold and hot colors indicate significant decreases and increases after voxel intensity nonparametric correction for multiple comparisons.

