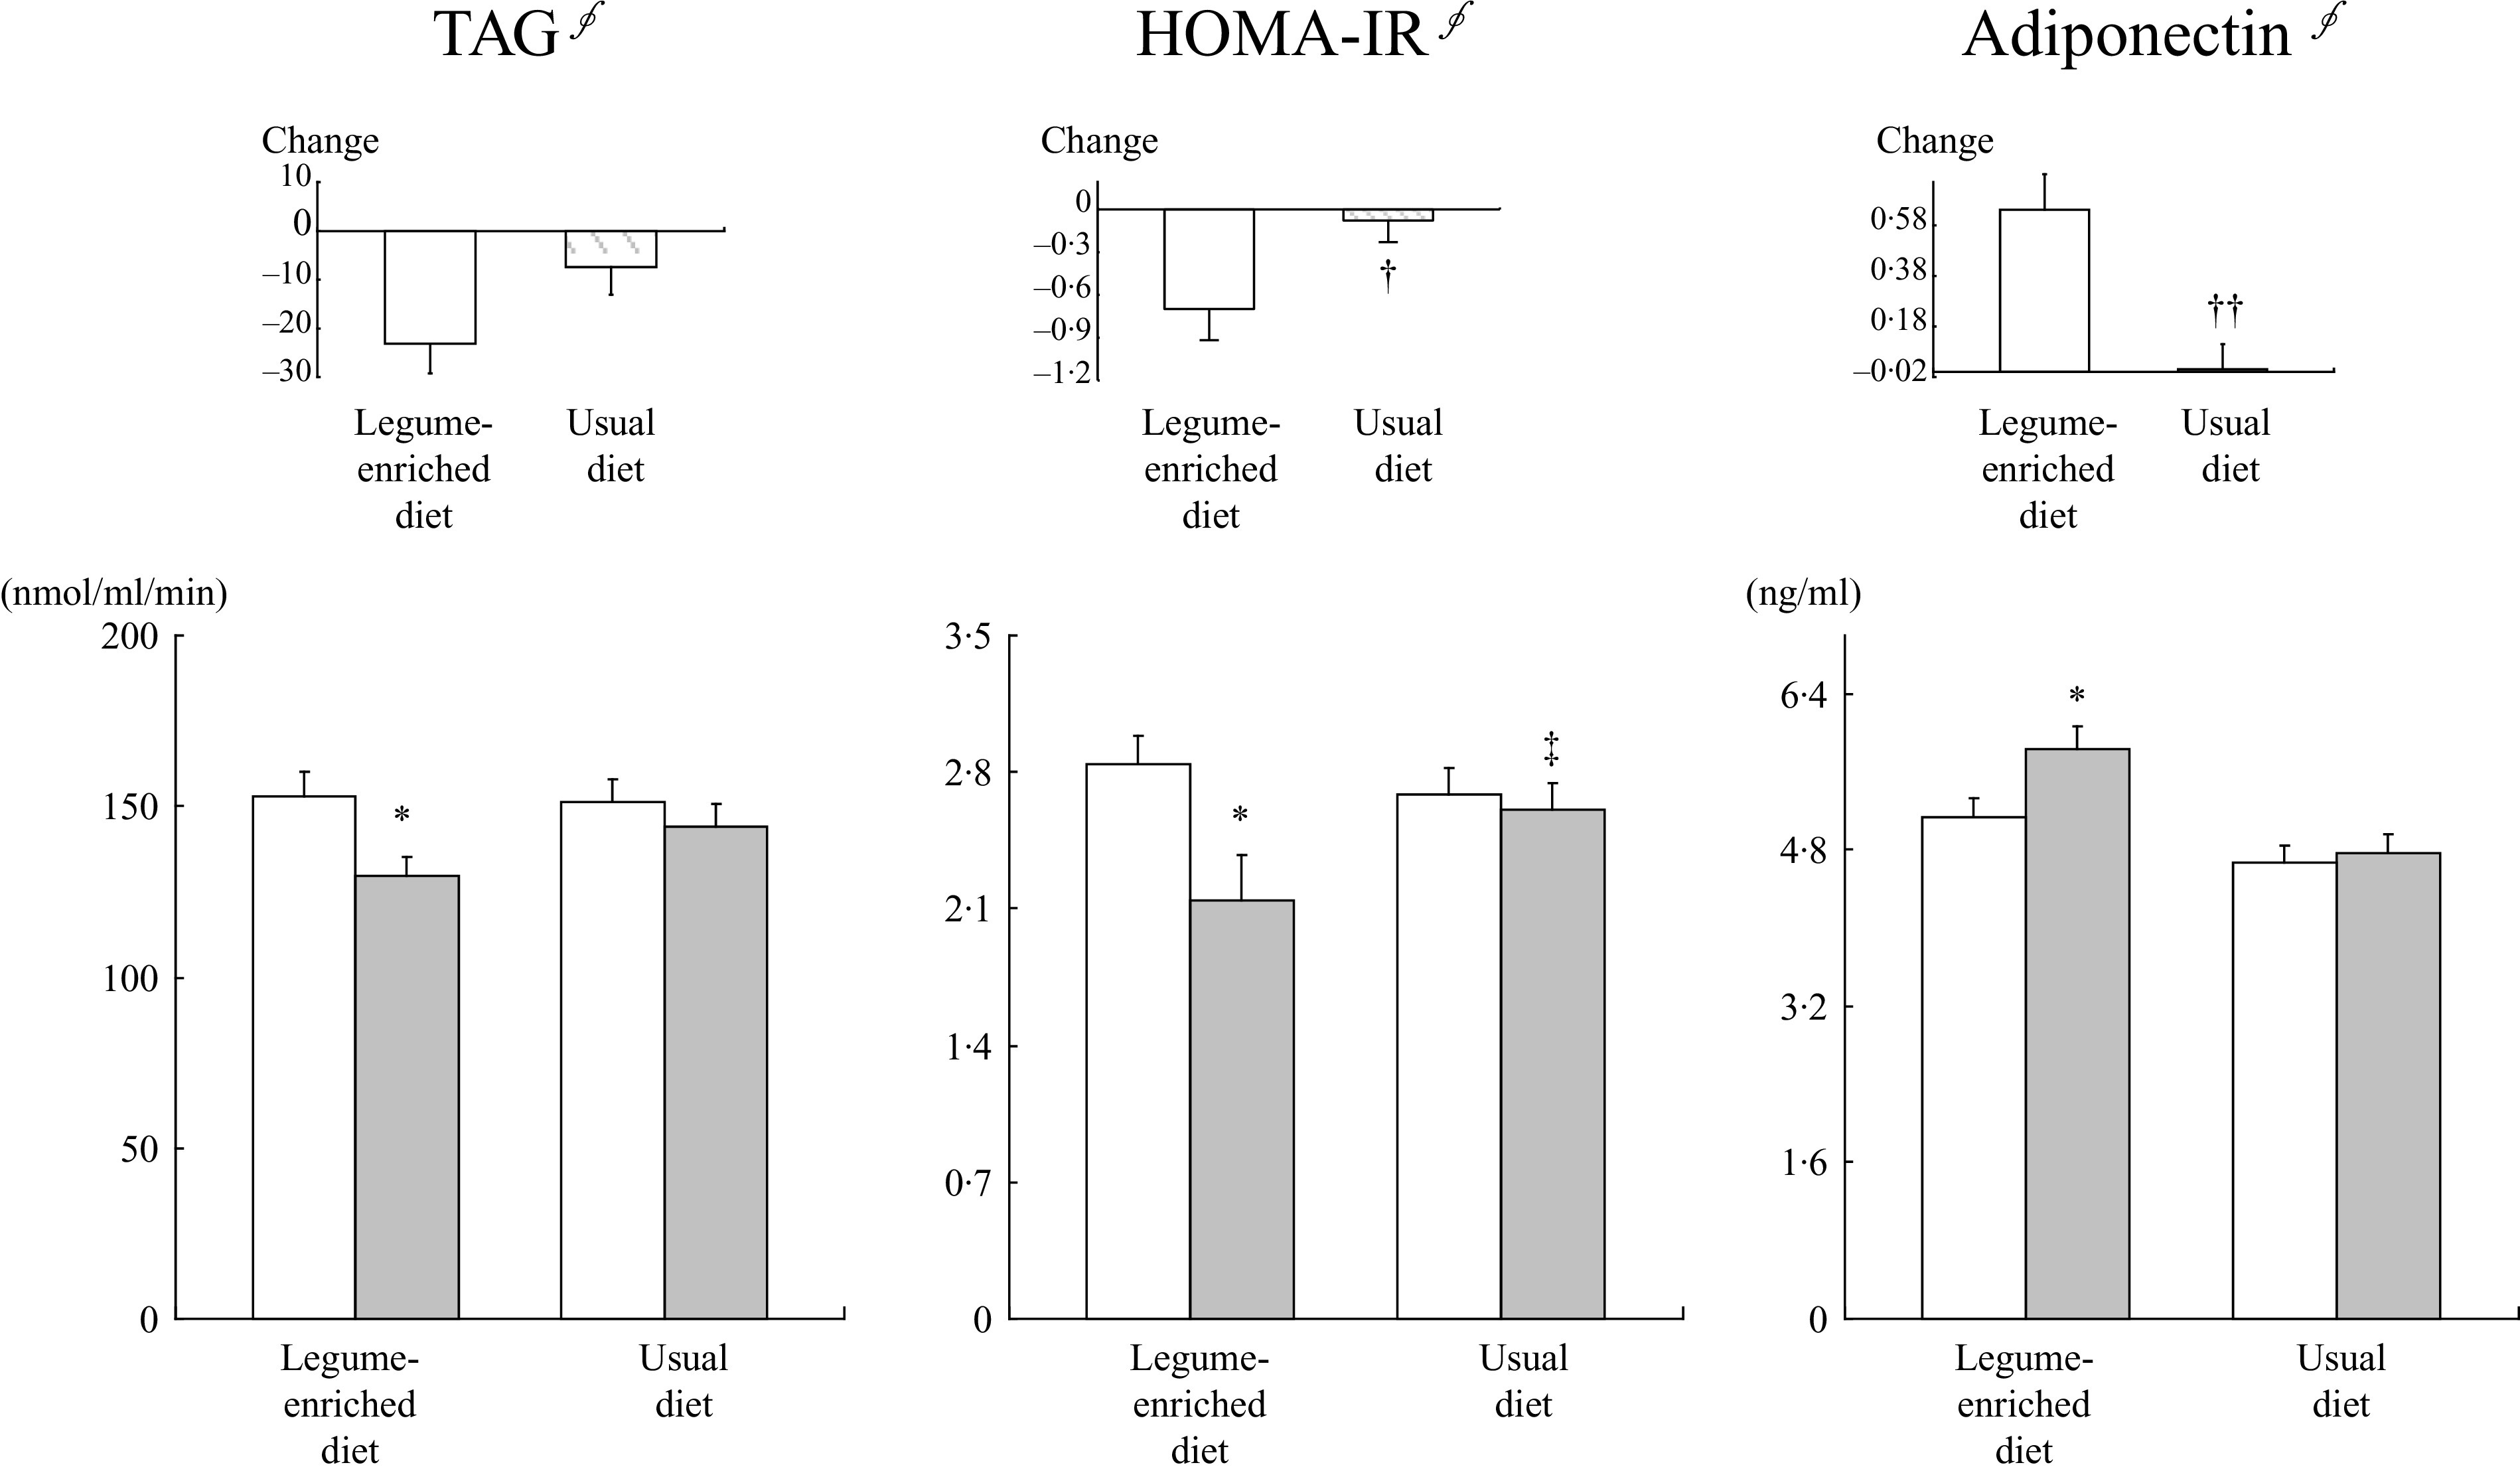
Fig. 1.

Effects of legume consumption on the levels of TAG and adiponectin and the HOMA-IR index value. Mean ± SEM. §Tested using log transformation. *P < 0·001 compared with baseline values in each group as tested using paired t test. P-values derived from independent t test. P′ = after adjusting for baseline value. ‡
P < 0·001 comparison between two groups at the 12-week follow-up and †
P < 0·05, ††
P < 0·001 comparison between two groups at changed values tested using independent t test. HOMA-IR, homoeostasis model assessment-insulin resistance.  , baseline;
  , 12-week.
