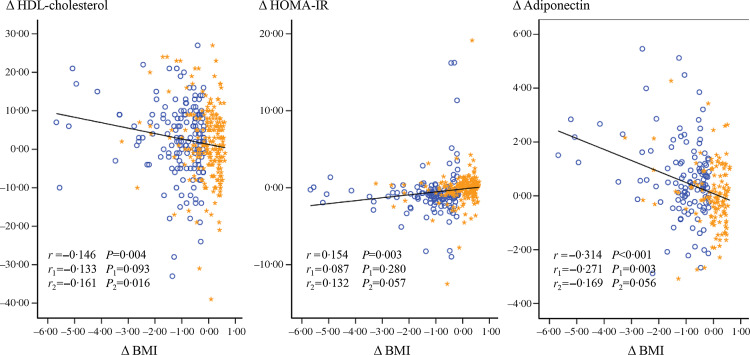
Fig. 2.
Correlations between changes (difference from baseline) in BMI, the HOMA-IR index value, and the levels of HDL-cholesterol and adiponectin in 383 subjects. r = Pearson’s correlation coefficients in all subjects. r
1 = correlation coefficients in the LD group. r
2 = correlation coefficients in the UD group. HOMA-IR, homoeostasis model assessment-insulin resistance.  , legume-enriched diet;
  , usual diet.

