
Fig. 3.
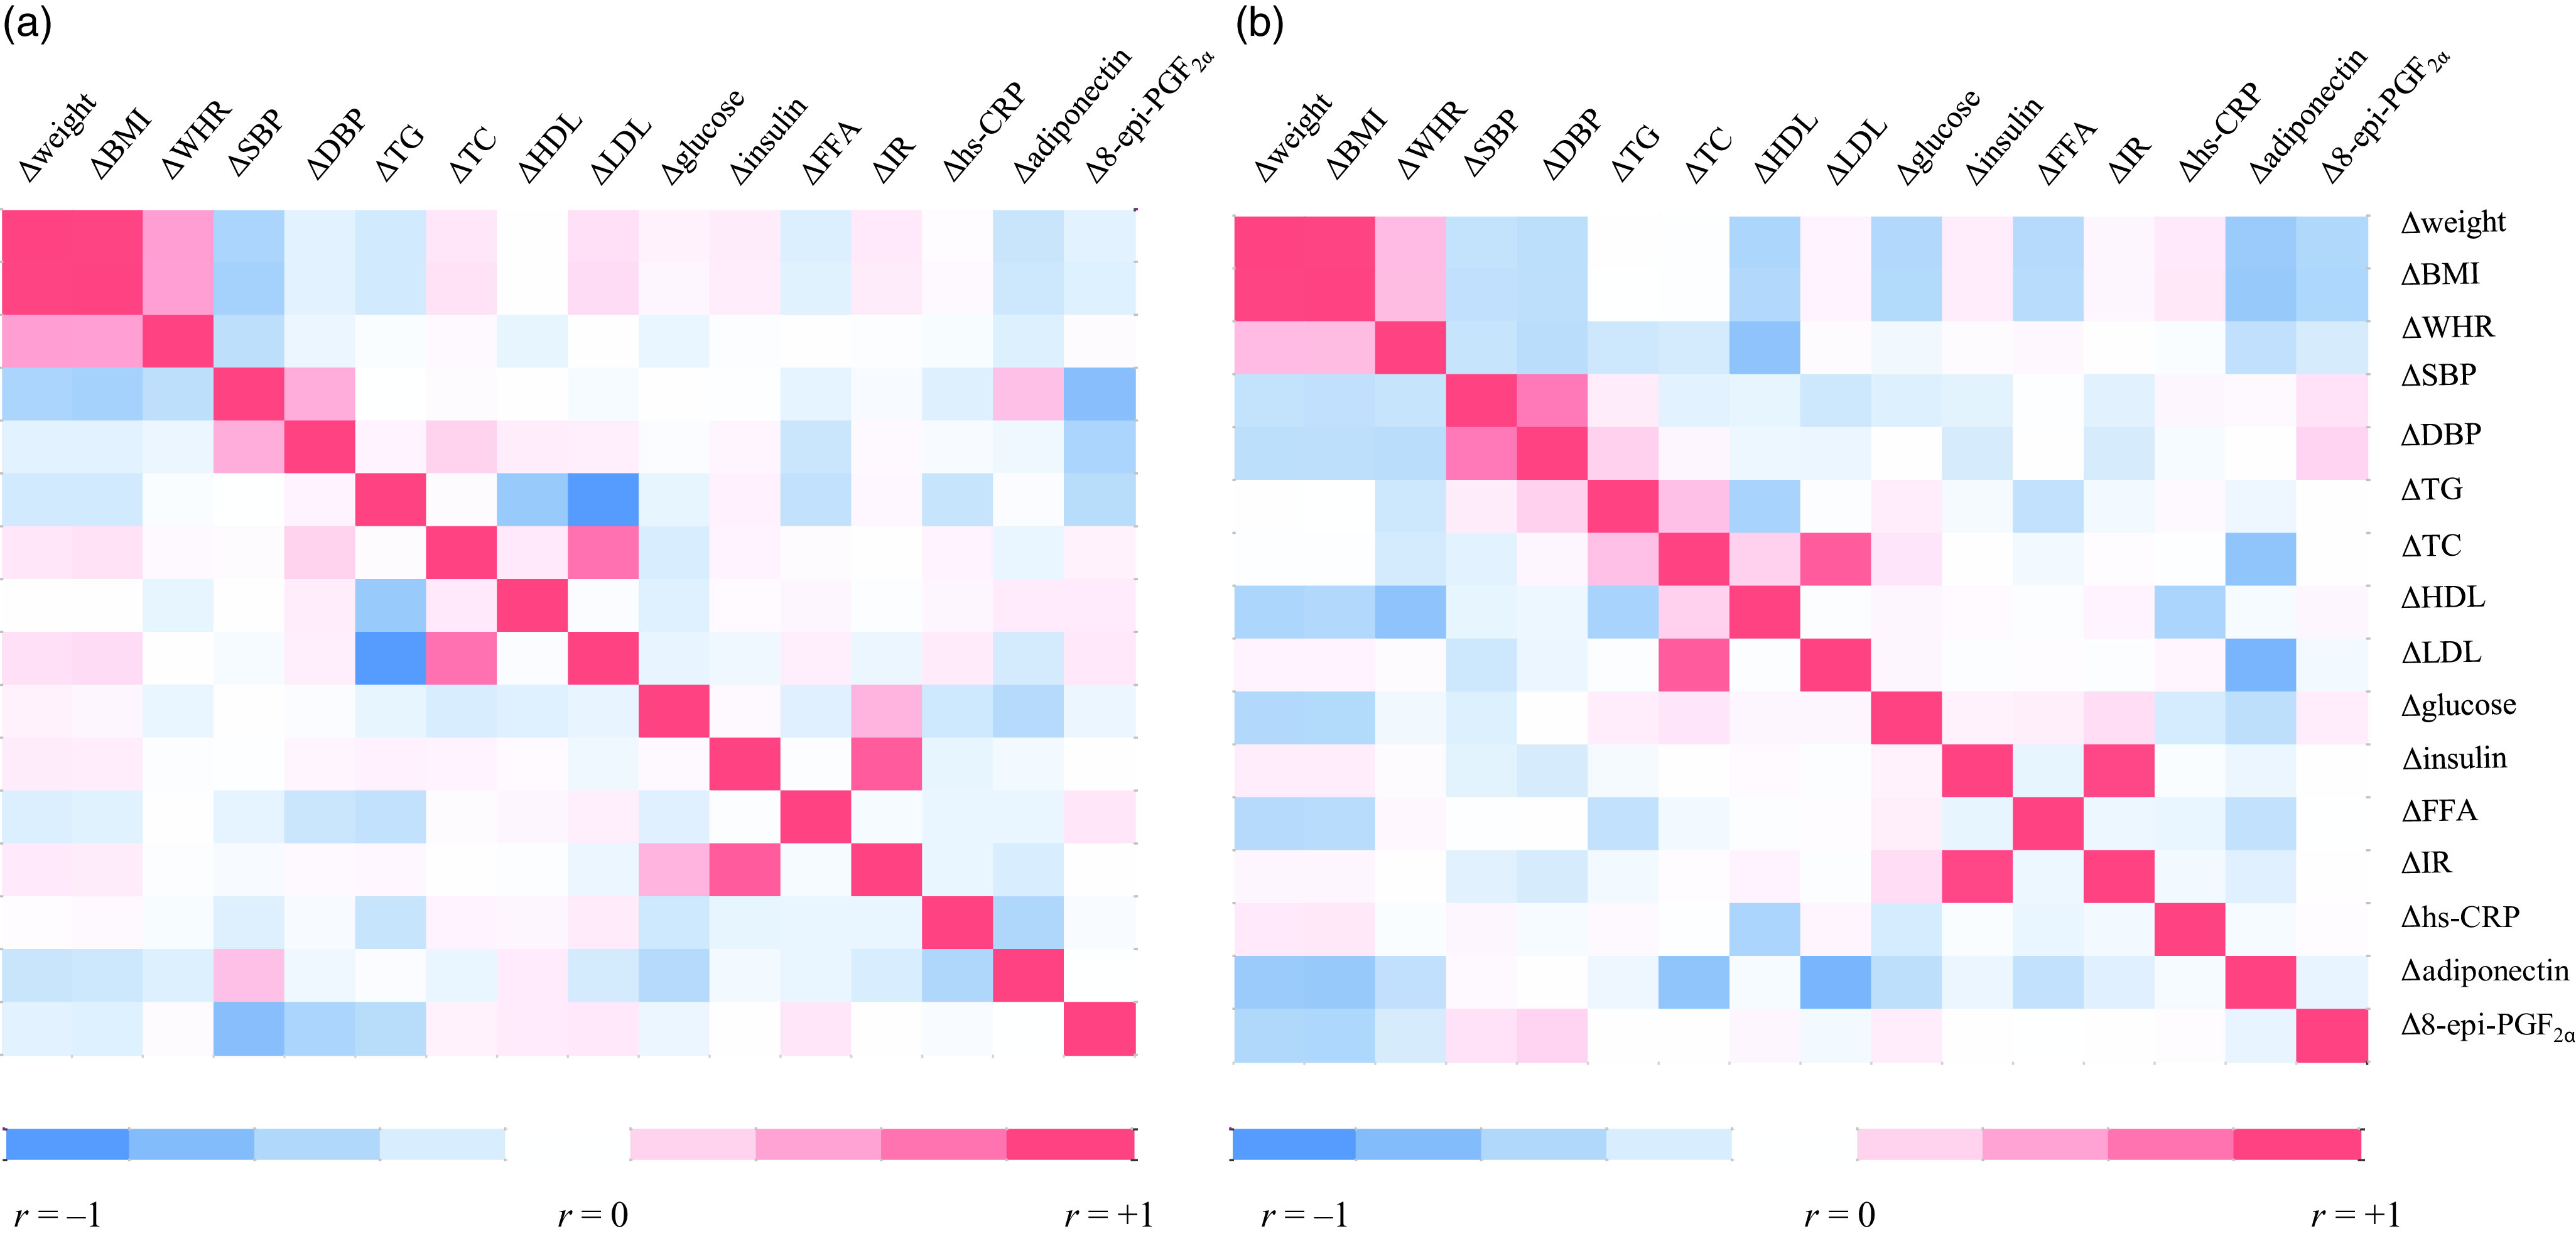
Correlations between changes (difference from baseline) in major indicators in the legume-enriched diet group by sex. (a) Male with legume-enriched diet. (b) Female with legume-enriched diet. r = Pearson’s correlation coefficients. Red represents a positive correlation, and blue represents a negative correlation.